
Article
Identifying methylene blue in the laboratory: infrared spectra and complementary methods
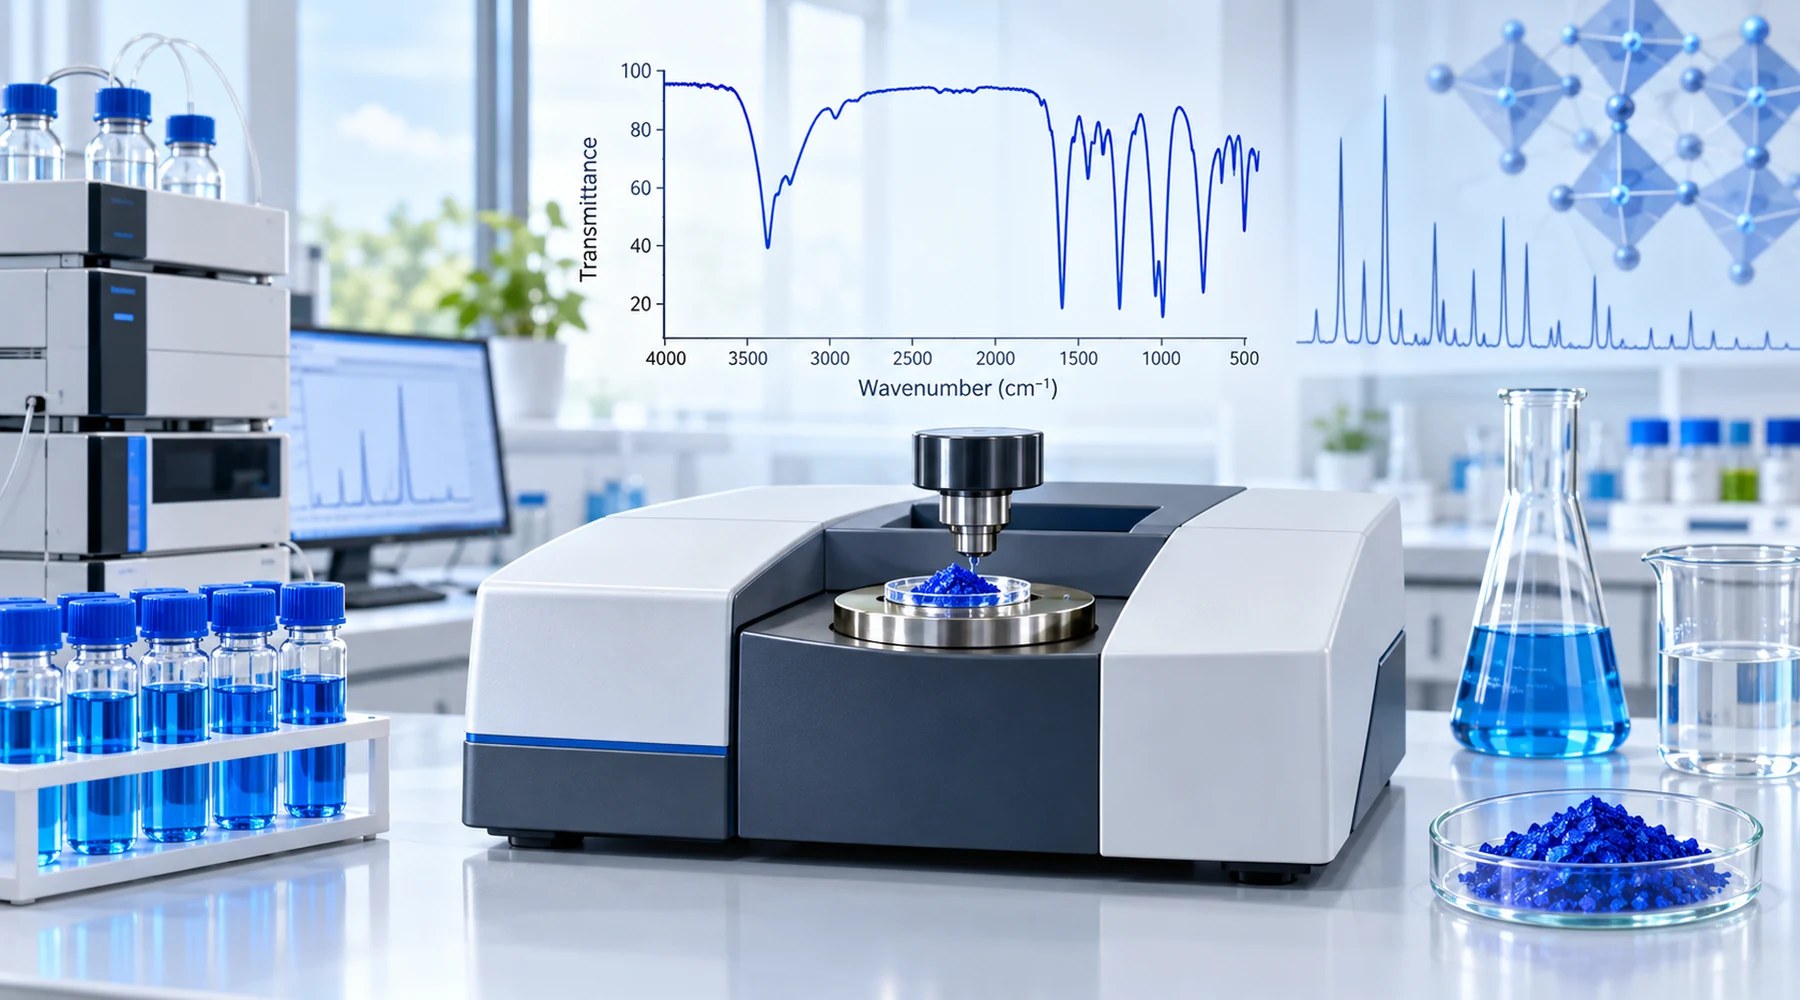
Imagine three laboratories receive the same blue powder. The first records an infrared spectrum and declares it methylene blue. The second runs chromatography and reports 0.4% Azure B. The third diffracts X-rays off the crystals and names a hydrate form. All three are correct, and none of them has answered the other two questions. Confusion starts when one result is read as all three.
This article separates those questions. Infrared identification establishes molecular identity against a reference standard. Chromatography establishes composition. Diffraction establishes solid-state form. A passing identity match is not a purity certificate.
Infrared identification answers one question well
The compendial identity test for methylene blue is a spectrum-against-standard comparison, not a checklist of peaks. Under the USP methylene blue monograph preview, Identification A cites infrared spectroscopy with either ATR optics or a potassium bromide pellet. The sample spectrum must correspond to the spectrum of the USP reference standard, with sample and standard prepared and recorded under equivalent conditions. No fixed list of diagnostic wavenumbers carries the verdict. The overlay does.
That design choice reflects how methylene blue FTIR spectra behave. The strongest features sit in the fingerprint region. Literature assignments consistently place the principal conjugated-ring band near 1590 to 1600 cm-1, where aromatic carbon-carbon and carbon-nitrogen stretching modes couple. Further bands near 1490 and 1390 cm-1 carry ring, carbon-nitrogen, and carbon-hydrogen deformation character. Bands near 1355 and 1330 cm-1 involve the dimethylamino carbon-nitrogen bonds and methyl deformations. Features near 1225 to 1250 cm-1 belong to the heterocyclic framework, while bands near 1170 to 1130 and 1066 cm-1 carry carbon-sulfur character, with aromatic C-H bending near 880 cm-1. Stretching modes appear higher: aromatic C-H near 3040 cm-1 and N-methyl C-H between roughly 2900 and 3000 cm-1. Published assignments differ in detail because the phenothiazinium skeleton vibrates as a coupled system, so treat any single assignment table as reported rather than unique.
Two preparation effects deserve attention because they change methylene blue IR spectra without changing the dye. First, hydrated material shows a broad O-H envelope around 3300 to 3500 cm-1 plus water bending near 1630 to 1640 cm-1, and different hydrate forms shift fingerprint bands measurably. Second, the KBr pellet matrix is hygroscopic: absorbed moisture produces bands in exactly those water regions and can masquerade as hydrate water from the sample. ATR sampling avoids the KBr matrix, but ATR intensities scale with wavenumber-dependent penetration depth, so an ATR spectrum and a transmission spectrum of the same powder are not directly superimposable. The practical rule follows from the compendial requirement: compare sample and reference recorded by the same technique, and document which one was used. For the underlying chemistry of the cation, salt, and hydrates behind these spectra, see the methylene blue structure and properties reference.
Analytical-method selection table
This table is the selection tool. Read across a row to find which question a method answers, what a passing result establishes, and what remains unproven.
| Method | Question it answers | What a passing result establishes | What it cannot establish |
|---|---|---|---|
| FTIR versus reference standard | Is this material methylene blue? | Molecular identity consistent with the reference spectrum | Purity, impurity profile, hydrate form alone, or concentration |
| HPLC-UV assay and organic impurities (phenyl column, 246 nm) | How much methylene blue and how much Azure B? | Chromatographic identity by retention match; assay and specified impurity amounts | Solid-state form; identity of unexpected peaks without standards |
| LC-MS/MS with qualified standards | Which demethylated dyes are present? | Separation and identification across the MB, Azure A, Azure B, Azure C, thionine series | Compendial status; this is a research-grade extension, not the routine monograph test |
| Powder XRD | Which crystalline hydrate is present? | Solid-state phase, phase mixtures above the detection limit, and crystallinity | Molecular identity of amorphous impurities; solution concentration |
| UV-Vis absorption | Does the solution absorb as expected? | Characteristic absorption maxima and concentration-dependent behavior | Identity or purity on its own |
| Chloride identity and loss on drying (supporting) | Is the counterion present; how much mass is volatile? | Salt form and drying mass under defined conditions | Which molecule carries the color |
Why an infrared match is not a purity certificate
An identity match rules out the wrong dye. It does not inventory the sample. Three limits matter most.
First, close relatives look alike in the infrared. Azure B differs from methylene blue by a single methyl group, so its spectrum closely resembles that of methylene blue. A mixture containing a few percent Azure B still overlays well against a methylene blue reference. Detecting that impurity is chromatography work, covered in the methylene blue impurities and test methods guide.
Second, infrared spectroscopy is a bulk technique with limited sensitivity to minor components. Small amounts of related dyes, residual solvents, or inorganic residues hide beneath the major bands. Absence of extra peaks is weak evidence of absence of impurities.
Third, the reference standard governs the whole comparison. A degraded, hydrated-shifted, or mishandled standard moves the goalposts. So does a mismatched technique pairing, such as an ATR sample spectrum judged against a KBr reference. Record the standard lot, the technique, and the preparation alongside every verdict.
Mixtures add a final caution. A spectrum that mostly matches, with shoulders or intensity anomalies, is not a pass with footnotes. It is a signal to separate the sample before identifying it.
Complementary methods in practice
Methylene blue HPLC provides the compositional answer that infrared cannot. The current compendial method uses a phenyl-type column with a water-acetonitrile gradient containing trifluoroacetic acid and detects at 246 nm, not in the visible band. Identity comes from retention-time correspondence with the reference standard; the same comparison supplies the assay. The organic-impurity test assigns Azure B with its own reference material at a relative retention near 0.8 against methylene blue at 1.0, and demands high resolution between the two peaks. Note the wavelength choice: the demethylation series absorbs progressively further toward the red, from thionine near 600 nm through Azure C, Azure A, and Azure B up to methylene blue near 670 nm. A detector fixed near 660 nm therefore responds unequally across the series and understates some homologues. Full profiling of the whole series, when needed, belongs on a C18 LC-MS/MS method with qualified standards for each analyte.
Powder diffraction answers the solid-state question that both methods above destroy or ignore: dissolving the powder for chromatography erases crystal information, and molecular vibrations report bonds rather than long-range packing. Diffraction patterns distinguish hydrate phases and crystallinity, and methylene blue needs that scrutiny more than most materials. Solid-state work by Rager and colleagues identified five distinct hydrate structures, including a pentahydrate, two dihydrates, a monohydrate, and an intermediate hydrate, and found no true trihydrate among the characterized forms. Laboratory handling matters here: humidity and temperature shift hydrate stability, and aggressive grinding can alter the phase or degrade crystallinity, so control and document relative humidity and temperature and keep milling minimal. Hydrate labeling and its effect on weighed mass are discussed further in methylene blue hydrate forms and labeling.
UV-Vis absorption plays a supporting role. The familiar maxima confirm expected solution behavior and enable concentration work, but a blue solution absorbing at the expected wavelength is consistent with methylene blue without proving it, since related dyes absorb nearby.
What to ask before buying
Translate these distinctions into purchasing questions. Ask which lot was tested, which technique established identity, whether the HPLC impurity test used the Azure B reference material, and whether hydrate form was characterized or assumed. Above all, ask whether the certificate covers the full specification or only selected tests. Many sellers that claim compendial conformance test only heavy metals, which leaves the identity, assay, organic impurity, solvent, and microbial questions unanswered.
Blupreme tests the full USP specification, covering identity, purity, organic impurities, residual solvents, elemental impurities, residue on ignition, microbial limits, and bacterial endotoxins, in partnership with a pharmaceutical manufacturer of methylene blue. The public certificate of analysis for each batch is published on Blupreme quality testing, so the assay basis and impurity results can be read directly instead of inferred. Results near 100% still need their calculation basis stated, as the assay above 100 percent guide explains. Identity matching opens the investigation. The full record closes it.