
Article
Why methylene blue's absorption changes with concentration
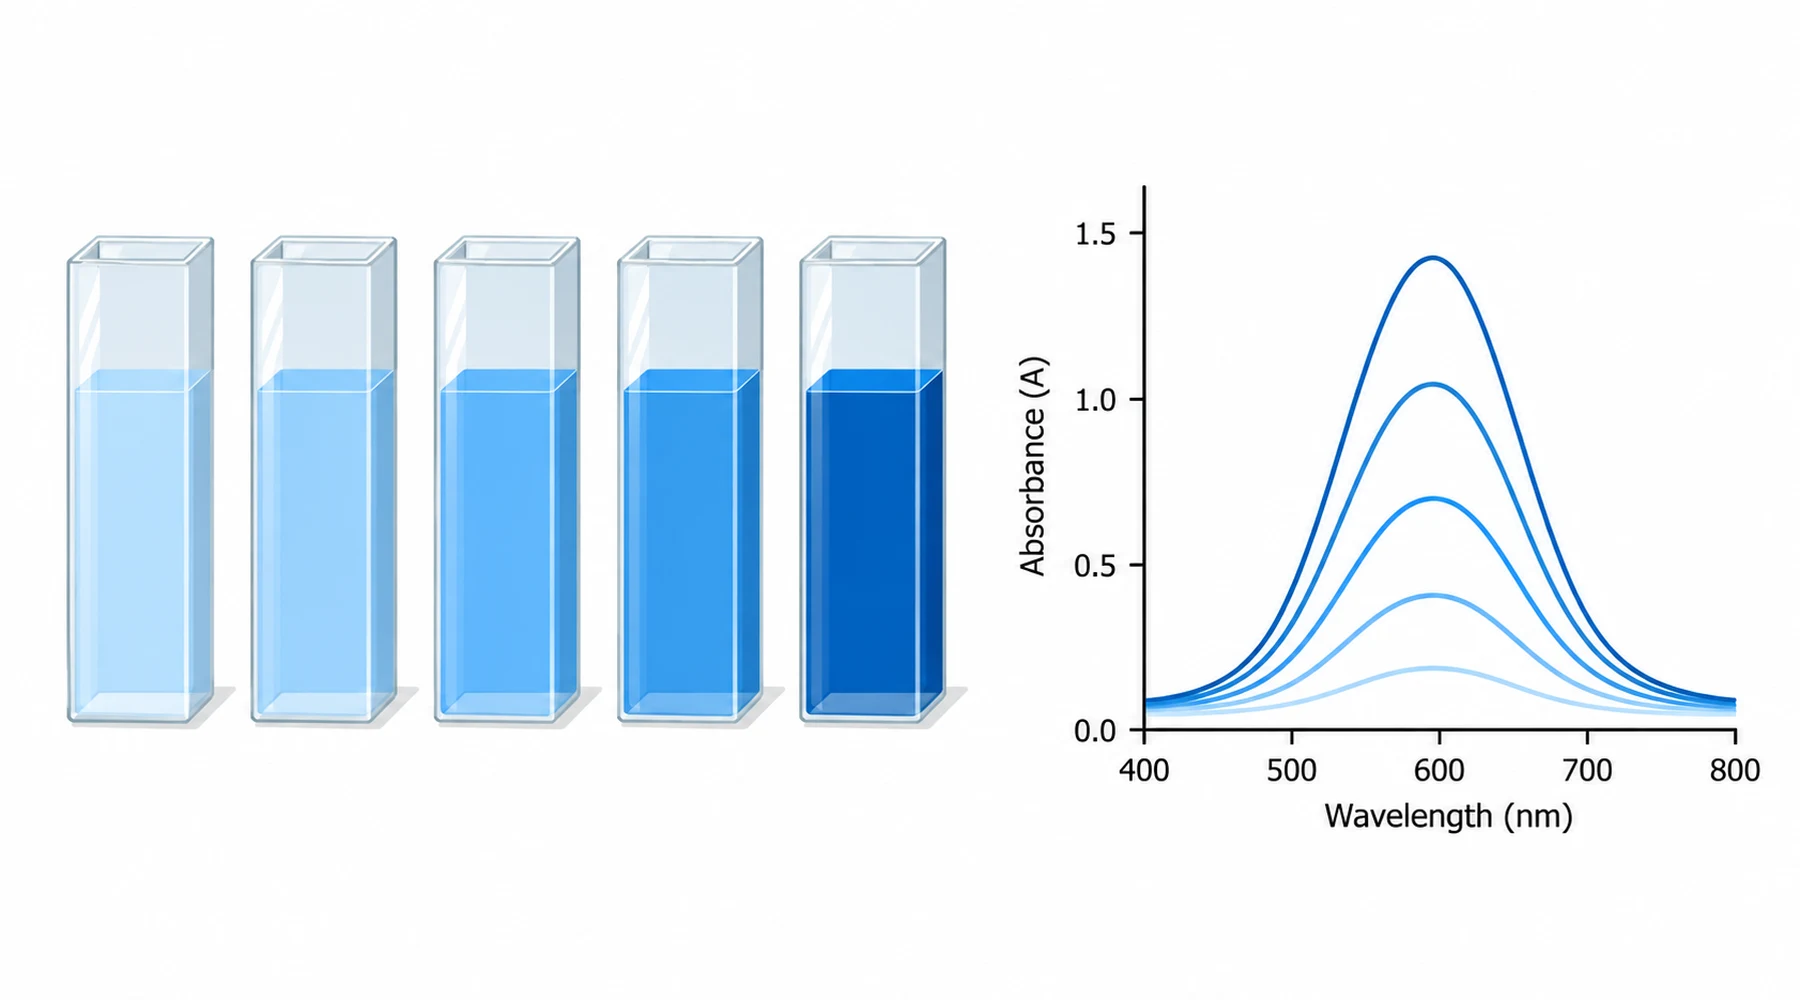
Take one stock bottle of methylene blue and pour two glasses. Fill the first from the stock and the second from a tenfold dilution. The second glass is paler, as expected. Look closely and something else has changed. The hue has shifted. One solution leans toward a clear sky blue and the other toward a violet tinged blue. Dilution did more than reduce intensity. It changed which chemical species does most of the absorbing.
The concept behind the shift is simple. Dissolved methylene blue is not one species. The single dye cation, called the monomer, can stack face to face with a second cation to form a dimer, and dimers can grow into larger aggregates. Each form has its own absorption spectrum. What a spectrophotometer reports is the sum over the mixture present in that cuvette, under those conditions. Change the mixture and the spectrum moves, even when the total dye content follows a straight dilution ratio.
Monomer and dimer are different absorbers
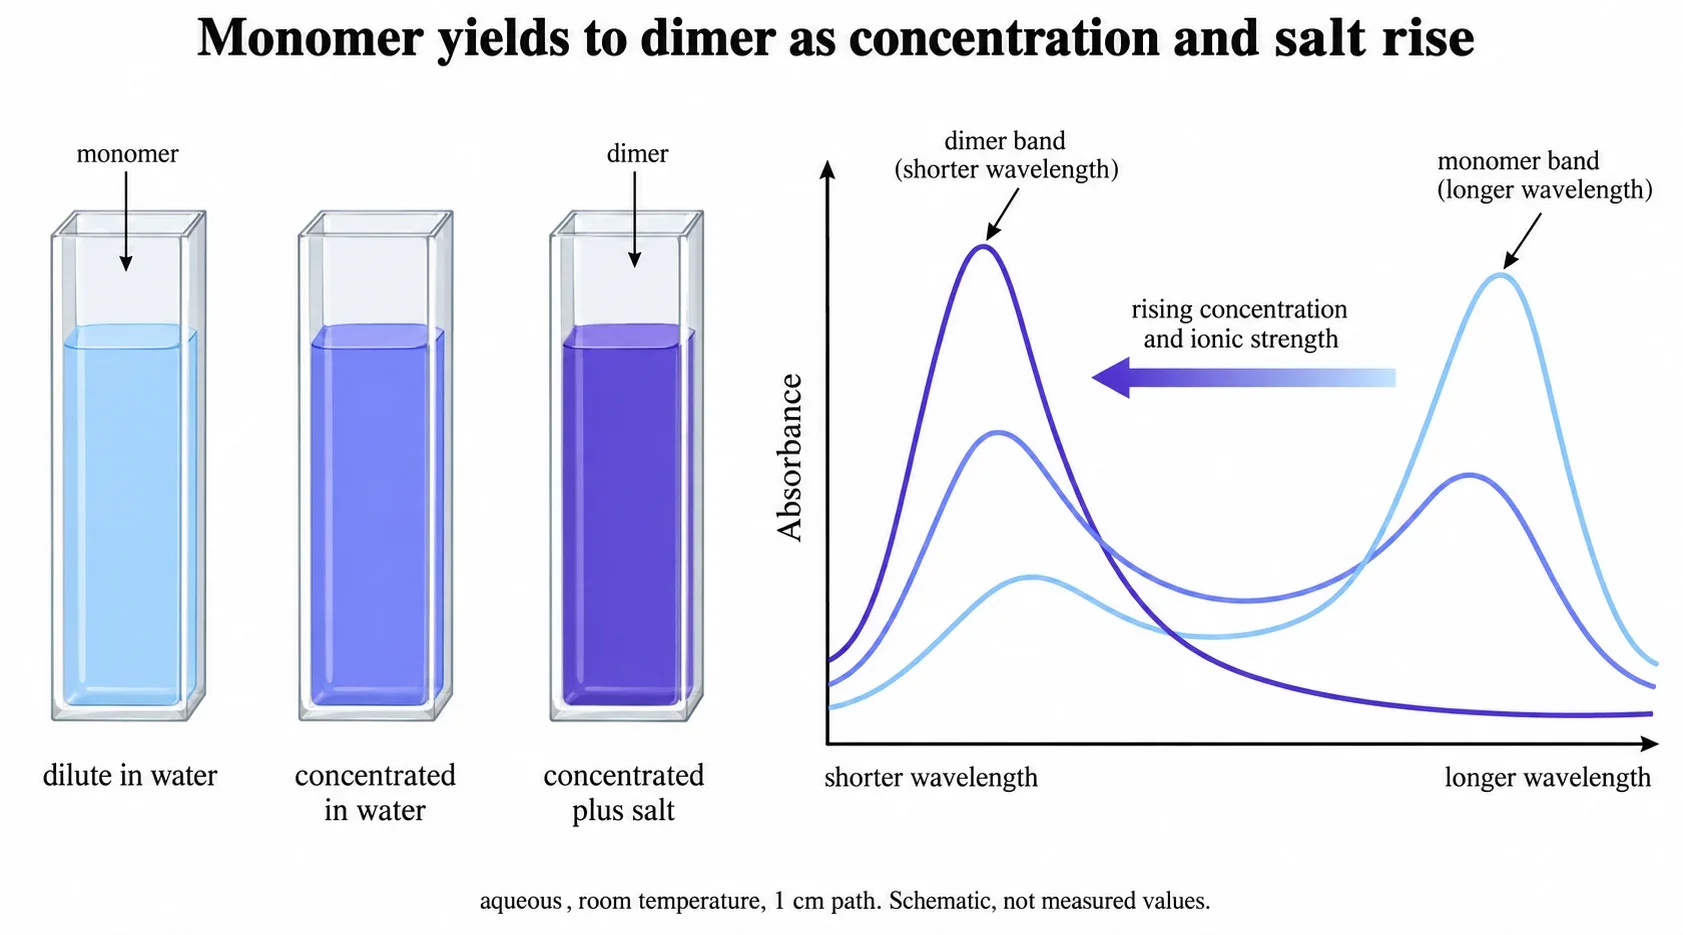
Picture the monomer as a flat card with a positive charge spread across its ring system. Two such cards can lie face to face. The positive charges repel, but the flat aromatic surfaces attract through stacking interactions, and surrounding water and counterions screen the repulsion. The result is a bound pair with shared electronic states. Its allowed transitions sit at higher energy than the monomer transition, so the dimer band appears at shorter wavelength than the monomer band, with larger aggregates contributing further toward the blue side as a shoulder.
At very low concentration in clean water, monomers dominate and the long wavelength band dominates. As total concentration rises, the paired form takes a growing share and the shorter wavelength band grows relative to the first. The ratio of the two bands therefore reports the composition of the mixture, not the total concentration directly. A single wavelength reading cannot separate the two without an assumption about which form is present.
This is why reference spectra always belong with conditions. The spectral reference for methylene blue tabulates band positions with the solvent, salt background, pH, temperature, and concentration range that produced them. Quote a peak without those conditions and the number is underspecified. Two laboratories can both be correct about different spectra from the same dye because they measured different mixtures.
What moves the equilibrium
Concentration is the main lever. Dimer formation needs two monomers to meet, so its share rises faster than linearly with total dye. Reported aqueous dimerization constants sit in the thousands per molar near room temperature, so the dimer share climbs steeply through the micromolar range. A broad global fit spanning micromolar to millimolar dye found nonzero tetramer contribution already below 34 micromolar, which warns against trusting a strict two species fit at tens of micromolar. Exact fractions depend on the medium, which is why this article gives directions rather than a universal conversion table.
Salt is the second lever. Dissolved ions screen the repulsion between two cations, so added sodium chloride and similar electrolytes push the mixture toward dimers and aggregates at the same dye concentration. This effect is visible in studies of methylene blue aggregation in saline and aqueous media, where dye from about 1 micromolar to 3.4 millimolar was measured across 0 to 0.15 molar sodium chloride. In that fit the tetramer fraction reached about 0.93 at the high dye, high salt corner. A spectrum recorded in water and one recorded in physiological saline are therefore not interchangeable standards.
Temperature pulls the other way. Stacking releases bound water and is opposed by thermal motion, so warming a solution typically dissociates some dimers back into monomers, while cooling favors association. The fitted dissociation enthalpy is negative, about minus 30 kilojoules per mole across 282 to 333 kelvin, which confirms exothermic association. A cold sample measured immediately after refrigeration can look more aggregated than the same sample measured after equilibration to room temperature.
Solvent sets the baseline. Water, with its strong hydrophobic effect, encourages flat dye cations to stack. Alcohols such as ethanol and methanol solvate the rings better and break up aggregates, so the same dye concentration looks more monomeric in ethanol than in water. Aprotic cosolvents do the same: in water and DMSO mixtures at 293 kelvin, added DMSO suppressed dimerization, which implicates water structure as a driver of stacking. Surfactants need care in both directions. Above their critical micelle concentration, micelles can solubilize monomers individually and restore a monomer-like spectrum. Below that point, an oppositely charged surfactant can promote stacking instead: at 100 micromolar dye, SDS driven polymerization peaked near 4 millimolar SDS, roughly half the micelle point, before redistribution at higher surfactant levels. Work on dye-solvent and organized-media effects on methylene blue spectra illustrates how strongly the immediate molecular neighborhood, not just the bulk concentration, sets the observed bands.
pH matters mainly at the edges. Across the near neutral range used in most laboratory work, methylene blue stays in its familiar cationic blue form, and aggregation dominates the spectral story. Strong acid or base, redox chemistry that produces the colorless leuco form, or binding to proteins and particles each add states beyond the monomer-dimer pair. When a spectrum changes after adding a buffer, check the buffer composition for salt and binding components before attributing everything to pH alone. The chemistry and protonation reference keeps these identity questions separate from the aggregation question treated here.
Why the Beer-Lambert straight line bends
The Beer-Lambert relation says absorbance equals absorptivity times concentration times path length. It is a counting law. It assumes the counted objects stay identical as their number changes: one absorbing species, fixed spectrum, no chemistry with concentration, monochromatic probing light, no scattering or re-emission, and light that actually traverses the stated path.
Aggregation breaks the first assumption. Formally, total absorbance remains a sum over species: path length times each absorptivity times its own species concentration. Each species obeys the law. The mixture does not, because the species concentrations are nonlinear functions of total dye. A calibration curve of absorbance at the monomer band against total dye therefore starts straight in the dilute limit and bends downward as concentration climbs, because each added increment brings proportionally less monomer. A curve read at the dimer band bends the other way. Aggregation work flags exactly this mechanism as the source of the observed Lambert-Beer deviations. Fitting a straight line through the bent region and extrapolating it is the standard error. The line is valid only inside the range and matrix where it was built.
Dilution creates a related trap. Diluting a concentrated stock to reach the instrument range does not preserve the species ratio. The diluted cuvette re-equilibrates toward monomer, so its spectrum correctly describes the diluted sample and misdescribes the stock. Back calculating the stock spectrum by scaling absorbances upward restores the total content estimate only if the calibration already accounts for the shift. It never restores the original band shape. Anyone comparing a concentrate spectrum against a dilute reference is comparing two different mixtures.
Path length is part of the result
Absorbance scales with the distance light travels through the sample. A 10 mm cuvette gives ten times the absorbance of a 1 mm cuvette holding the same solution. That scaling is exact only for the same solution, and aggregation makes the qualifier load bearing.
In practice, path length is a tool for staying inside the valid range. A long path gives sensitivity for dilute, mostly monomeric solutions. A short path keeps a concentrated sample on scale without a large dilution step that would reset the equilibrium. The aggregation program behind the numbers above practiced exactly this: 1 centimeter cells for 1.1 to 34 micromolar dye, and 0.01 centimeter cells for 94 micromolar to 3.4 millimolar. Microvolume pedestals and plate readers add geometry of their own, with short and sometimes variable paths plus surfaces where cationic dye can adsorb. Report the path with the number, the same way the spectral reference reports solvent and salt. An absorbance without a path length is not a result. It is a rumor.
Measurement discipline follows from the mechanism. Equilibrate samples to one temperature before reading. Use the same cuvette type and orientation, matched blanks containing the same salt and buffer background, and clean glassware, because methylene blue adsorbs to glass and plastic and a stained cuvette carries a memory of the last concentrated sample. Read promptly after preparation when aggregation kinetics matter, and build each calibration curve in the same matrix at the same path length as the unknowns. For visual checks, remember that the eye is a poor spectrometer. Whether solution color can establish purity is a separate question with a negative answer, and hue shifts from aggregation are one reason.
A diagram to keep beside the instrument
The figure below compresses the article into one bench reference. Three solutions share the same dye but differ in total concentration and salt background. Their schematic spectra show the long wavelength monomer band losing share to the shorter wavelength dimer band as stacking increases. Conditions are printed on the figure because without them the curves cannot be reused. For measured band positions under stated conditions, use the spectral reference. For how the dye enters cells once it is in solution, see cell entry through reduction and partitioning. For how light dose and geometry further shape photochemical readouts, see light exposure and measurement geometry.
| Condition change | Direction of shift | Practical consequence |
|---|---|---|
| Higher total dye concentration | Toward dimer and larger aggregates | Monomer band calibration bends downward; rebuild the curve in range |
| Added salt at fixed dye content | Toward stacked forms | Water and saline spectra are not interchangeable |
| Warming toward room temperature | Toward monomer, reversibly | Equilibrate refrigerated samples before reading |
| Water replaced by ethanol | Toward monomer | Solvent is part of the reference, not a detail |
| Surfactant above micelle point | Toward solubilized monomer | Detergent matrix needs its own blank and curve |
| Dilution into instrument range | Toward monomer in the cuvette | Back calculation estimates content, not the stock spectrum |
| Shorter optical path | Lower absorbance, same mixture | Prefer short path over large dilutions for concentrates |
The rule to carry away has two halves. Spectrum identifies the mixture present in the cuvette under the stated conditions. Only a calibration built under those same conditions converts an absorbance into a total concentration.