
Article
Methylene blue absorption spectrum and molar absorptivity: a condition-labeled reference
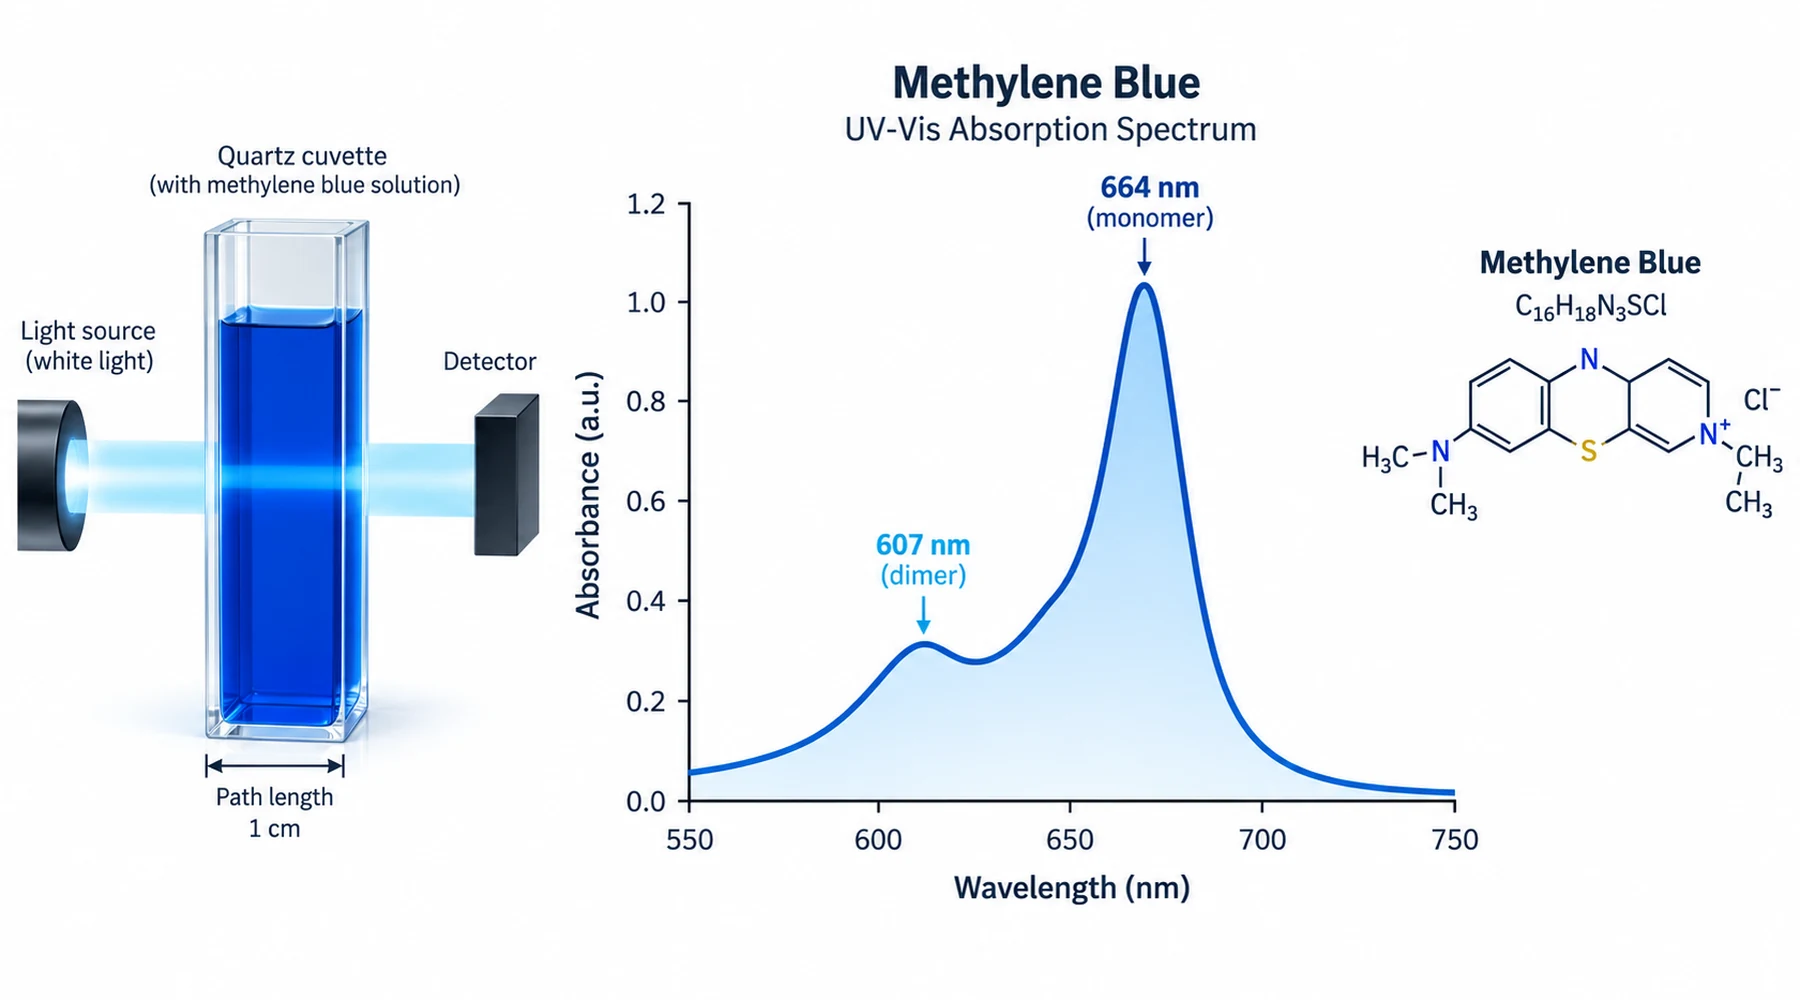
A methylene blue spectrum looks simple until you try to reuse a number from it. One lab reports a molar extinction coefficient near 82,000. Another reports 67,000. A third reports over 100,000. All three can be correct descriptions of their own measurements, and none of them is a universal constant for the dye.
The confusion comes from mixing two distinct concepts. Absorbance is a measurement made on a specific solution in a specific cell. Molar absorptivity, often written as epsilon, is a parameter in a model of that solution. When methylene blue changes its association state, the model changes, so the parameter changes too. The useful habit is to treat every coefficient as a labeled value: wavelength, solvent, pH or buffer, temperature, concentration range, and path length travel with the number.
The monomer band in dilute water
In dilute aqueous solution, the dominant band of the methylene blue cation sits near 664 to 665 nm, commonly quoted within 664 to 668 nm across instruments and calibration choices. That band is the right choice for quantification when the solution is dilute enough that most of the dye is monomeric.
Three literature values show why the conditions matter more than the headline number. Clay researchers who kept aqueous samples below about 7 micromolar in 1 cm cells reported epsilon of about 82,000 M-1 cm-1 at 665 nm. That value is unusually well documented as an empirical calibration slope for very dilute water samples. A later primary calibration in deionized water, using 2.34 to 37.52 micromolar and a 1 cm path, gave about 67,100 M-1 cm-1 at 665 nm for total dye. The lower result is expected, not contradictory, because the upper half of that calibration range already contains appreciable dimer. A third value, about 73,460 M-1 cm-1 at 664 nm, comes from work at pH 6.86 and 293 K that decomposed the observed spectrum into monomer and dimer parts, as summarized in a recent critical review of methylene blue photophysics. That number is a deconvolved monomer component, not a direct slope of absorbance against total dye.
The practical point: pick the coefficient whose conditions match your samples, or calibrate your own. Do not import 82,000 into a 30 micromolar phosphate buffer assay and assume linearity still holds.
The short wavelength shoulder is a mixture
As concentration rises, a shoulder near 600 to 615 nm grows relative to the 664 nm peak. Modern work usually places the H type dimer contribution near 605 to 610 nm. The global spectral analysis of methylene blue in water resolves a dimer maximum at 607 nm and a higher aggregate maximum at 600 nm, with monomer resonance components at 664 and 650 nm. Its full text is available through the open access record for PMID 33251415.
That shoulder should not be labeled as pure dimer absorbance. Monomer vibronic structure also contributes in the same region, so the measured height is a superposition. One global fit found that a monomer plus dimer model failed across the full 1.1 micromolar to 3.4 millimolar range, while adding a tetramer gave the best fit, with tetramer signal already detectable below 34 micromolar. The fitted component strengths were large: about 107,800 M-1 cm-1 at 664 nm for the main monomer component, about 101,400 for the dimer at 607 nm, and about 138,500 for the tetramer at 600 nm, in unbuffered deionized water with sodium chloride from 0 to 0.15 M and temperatures from 282 to 333 K. Those are model resolved parts, so they must not be substituted for an empirical Beer Lambert slope.
Dimerization strength has been quantified directly. At pH 6.86 and 293 K, one study obtained a dimerization constant near 3,900 M-1. That magnitude explains why a 5 micromolar working solution behaves nearly linearly while a 50 micromolar stock does not. A useful check during method development is the ratio of absorbance near 610 nm to absorbance near 665 nm. When that ratio climbs with concentration, epsilon at 664 nm no longer describes one invariant species.
Over a concentration interval dominated by one interconverting pair, spectra can share an isosbestic point, experimentally near 625 nm in aqueous series. A clean stationary point is consistent with two dominant species. When the point drifts or disappears as concentration rises, treat it as a warning that higher aggregates or shifting equilibria have entered, not as instrument error.
Solvent, pH, and temperature move the spectrum
Water favors association. Adding dimethyl sulfoxide suppresses dimerization, shifts absorption and fluorescence maxima to longer wavelength, and increases fluorescence quantum yield about fourfold, according to the solvent study of methylene blue in water and DMSO mixtures, indexed as PMID 30933781. That work treats aqueous spectra as a monomer dimer equilibrium with monomer absorbance near 650 to 670 nm and dimer absorbance near 580 to 615 nm, and it derives dimerization constants from the spectra at 293.15 K.
Alcohols shift both position and apparent strength, but they do not abolish aggregation. In one primary comparison at 31.3 micromolar and room temperature, reported in a methylene blue solvent study, the long wavelength maximum was 665 nm in water but 655 nm in methanol, with apparent total solution values near 37,100 in water and 60,800 in methanol. A separate validation in absolute ethanol at 298 K gave a maximum at 655 nm with epsilon near 68,000.
Ordinary pH changes move the spectrum less than many protocols assume. The critical review cited above reports that from about pH 2 to pH 12, the maximum stayed near 665 nm with only small strength changes through pH 11. Buffer identity and ionic strength can shift results as much as nominal pH, so record the actual buffer and salt, not only the pH meter reading. Strong acid or strong alkali is a separate case because the dye can undergo chemical change rather than reversible association. Temperature and salt also shift the equilibrium, which is why the 2020 water study varied both deliberately.
Measuring so the number stays valid
Quantitative work rests on the Beer Lambert relation, absorbance equals epsilon times concentration times path length, plus proof that the linear interval actually holds under your conditions.
Use a 1 cm cell for low micromolar work. With epsilon near 82,000, 5 micromolar gives absorbance near 0.41 and 10 micromolar gives about 0.82. For monomer focused measurement in plain water, staying near or below roughly 5 to 7 micromolar is safer than calibrating deep into the tens of micromolar. For concentrated stocks, shorten the path instead of accepting absorbance far above 1.
Blank with the identical matrix: same water grade, same cosolvent fraction, same buffer and salts, minus dye. Prepare calibrants in that same matrix at the same temperature. Scan the full visible range during development, ideally about 550 to 750 nm, rather than reading a single wavelength. Track shape, not only height. If serial dilution changes the normalized shape, the system is chemically concentration dependent. A stable maximum and a stable 610 to 665 nm ratio are stronger evidence for an acceptable range than a high R squared alone.
Document the reagent form. Commercial material may be anhydrous methylthioninium chloride or a hydrate such as the trihydrate, so the molar mass used for stock calculations must match the actual bottle. This step alone explains part of the disagreement between nominal molar concentrations across labs. Similar discipline applies when results feed quantitative assay calculations, when spectra support formulation stability checks, and when impurity profiles require purity and specification review.
Condition labeled summary
Use this table as the starting template for a lab record, not as a source of interchangeable constants.
| Species and wavelength | Conditions | Reported epsilon or behavior |
|---|---|---|
| Monomer, 665 nm | Water, below about 7 micromolar, 1 cm, pH not reported | About 82,000 M-1 cm-1, empirical total dye slope |
| Monomer component, 664 nm | Water, pH 6.86, 293 K, deconvolved from dimer | About 73,460 M-1 cm-1, monomer part only |
| Total dye, 665 nm | Deionized water, 2.34 to 37.52 micromolar, 1 cm | About 67,100 M-1 cm-1, calibration slope over a partly aggregating range |
| Monomer resonance, 664 nm | Unbuffered deionized water, 1.1 micromolar to 3.4 millimolar series, NaCl 0 to 0.15 M, 282 to 333 K | About 107,800 M-1 cm-1, model resolved component |
| Dimer, 607 nm | Same series as above | About 101,400 M-1 cm-1, model resolved component |
| Tetramer, 600 nm | Same series as above | About 138,500 M-1 cm-1, model resolved component |
| Total dye, 665 nm in water vs 655 nm in methanol | 31.3 micromolar, room temperature | About 37,100 in water, about 60,800 in methanol, apparent values at that concentration |
| Monomer to dimer equilibrium | Water to DMSO mixtures, 293.15 K | DMSO suppresses dimer, maxima shift to longer wavelength, emission yield rises |
The methylene blue absorbance wavelength is therefore a short answer with a long footnote. Report the peak you measured, in the solution you measured, at the concentration you measured. That habit keeps one dilute aqueous value near 664 nm from turning into a false universal constant.