
Article
Methylene blue yeast assays: counting live cells versus timing respiration
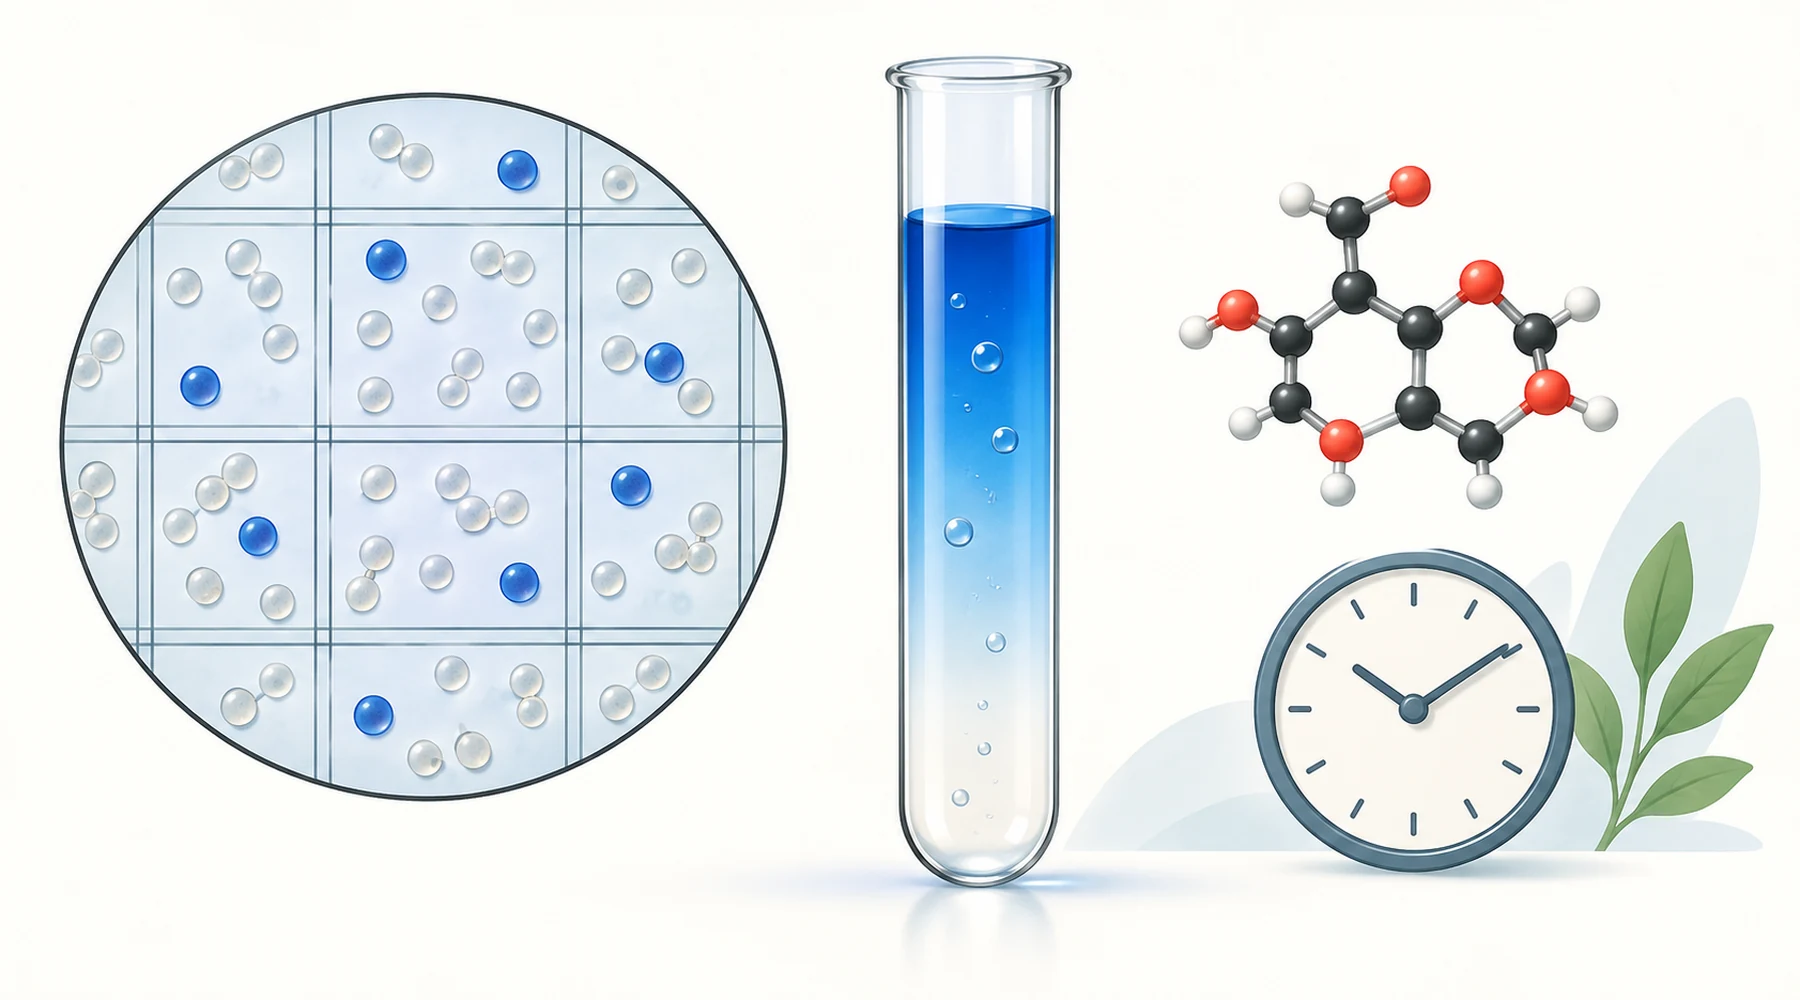
Two tubes sit on the bench. Both are blue. In one, blue cells under the microscope mean dead yeast. In the other, a tube that turns from blue to colourless means the yeast is alive and respiring. Same dye, opposite readings. Confuse the two assays and every conclusion flips.
The distinction is the whole article. Methylene blue is a redox dye: oxidised it is blue, reduced it is colourless leucomethylene blue. A viability count exploits that chemistry in a short microscopic snapshot. A respiration experiment exploits it in a bulk timed reaction. Each needs its own protocol, its own controls, and its own scepticism.
The viability count: a short stain, read promptly
The brewery style protocol is the most standardised version. Prepare 0.01% w/v methylene blue in 2% sodium citrate, mix it 1:1 with the yeast suspension, and examine the mixture after a short fixed interval. Published intervals vary from 1 to 2 minutes in the Brewing Science Institute handbook to about 5 minutes in research protocols, with the OIV wine microbiology method requiring examination within 10 minutes. The dye in the counting mixture ends up near 0.005%. Load an improved Neubauer chamber, and at about 400x classify dark blue cells as nonviable and unstained cells as viable. Light blue cells are scored as alive in the OIV method, which already hints at the subjectivity problem discussed below.
Cell concentration comes from the chamber geometry. When the full central 1 mm square is counted, cells per mL equal N times the dilution factor times 10^4, where N is the count in that area, as set out in the ASBC yeast methods. Viability is simpler: unstained cells divided by total cells, times 100. Count about 400 cells for a viability estimate, following the FEMS brewery comparison study and OIV practice. Use one boundary rule consistently, for example including cells on the bottom and left grid lines and excluding those on the top and right.
Buds need a rule before counting starts. A common convention counts a bud as a separate cell once it reaches about half the size of the mother cell, and with the mother below that. Whatever rule is chosen, apply it to every square and write it on the worksheet so the next person repeats it.
Counting worksheet (print this)
This worksheet is an original asset for this article. Copy it into a notebook or print one per sample.
| Field | Entry |
|---|---|
| Sample ID and dilution | |
| Dye stock (target 0.01% in 2% citrate) | |
| Mix ratio and stain interval used | |
| Bud rule applied | |
| Boundary rule applied |
| Square | Unstained (live) | Dark blue (dead) | Notes (buds, debris, clumps) |
|---|---|---|---|
| 1 | |||
| 2 | |||
| 3 | |||
| 4 | |||
| 5 | |||
| Total |
Viability (%) = 100 x unstained / (unstained + dark blue). Total cells per mL = N x dilution factor x 10^4, with N from the defined chamber area. Record the stain interval next to the result, because a viability number without its timing is not reproducible.
Why viability numbers drift
Timing is the first interference, and it cuts both ways. Metabolically active cells reduce the dye, so an early read can catch live cells before they finish reducing it and misclassify them as dead. But prolonged exposure is itself toxic and creates genuinely damaged blue cells, producing false death staining. A laboratory teaching protocol therefore specifies scoring within 5 minutes, as documented in a Wisconsin yeast teaching protocol. The safe formulation is that methylene blue scoring is time dependent, so fix one short interval and hold it constant across every sample in a series.
Low viability samples carry a second bias. The standardised method warns that methylene blue can overestimate true viability below about 80%, because cells that still reduce dye need not retain reproductive capacity. Brewing literature describes the same unreliability when viability is substantially degraded. Treat methylene blue as a rapid approximate estimate, and confirm critical low viability decisions, such as repitching a culture, with plate counts or a complementary stain.
Matrix effects come third. The OIV method runs near pH 4.6 and warns that strongly buffered low pH samples prevent correct dye behaviour, while advising against the assay above 100 g/L sugar, where cells read misleadingly light blue. An experimental comparison of staining pH found substantially altered sensitivity across the tested range, consistent with a pH dependent methylene blue method study. Debris is a separate trap: stained particles in dirty mashes mimic dead cells and inflate operator to operator variability.
That variability is quantified, not anecdotal. In a six month brewery trial reported in the FEMS yeast comparison, duplicate methylene blue measurements averaged 6.1% standard deviation against 0.2% for oxonol flow cytometry, with two operators differing by up to 13 percentage points on the same sample. A 2023 quantitative comparison of viability methods found fluorescence microscopy and flow cytometry substantially more precise, while showing that performance depends on species and matrix. The classic method description by Painting and Kirsop (PMID 24430080) remains the reference point, and a broader review of yeast viability and vitality assays (PMID 25154541) places methylene blue among complementary rather than definitive tests. Trypan blue is not the automatic upgrade here: it reports membrane integrity loss, while methylene blue reports uptake plus reducing activity, so stressed cells can classify differently under the two dyes.
The respiration experiment: time the blue disappearing
The second assay never looks through a microscope. Yeast plus glucose plus dilute methylene blue goes into a closed tube, and the clock measures how long the blue takes to vanish. As cells metabolise, they generate reducing equivalents that convert blue dye to its colourless form, while dissolved oxygen reoxidises it back. Once the cells draw oxygen down, net reduction wins and the tube decolorises. The endpoint therefore reflects the balance of respiration, dye concentration, and oxygen availability, and it should be reported as methylene blue reduction or decolorisation time, not as a direct molecular oxygen consumption rate.
Use a far more dilute dye than in viability work so the timing lands in a convenient window. The AQA A level required practical handbook standardises this well: 1 g glucose per 100 mL water warmed to about 30 C, 5 g dried yeast added immediately before use, and a working dye near 0.001% prepared by diluting 0.1 mL of a 1% stock to 100 mL. Mix 2 mL of yeast glucose suspension with 2 mL of working dye, equilibrate at the test temperature, shake once for 10 seconds, start the timer, and do not shake again. Shaking reintroduces oxygen and reblues the tube, which is the single largest procedural artefact. AQA notes the preparation should normally decolorise within about 5 minutes at 35 C, with trial means of 275 s at 20 C, 128 s at 35 C, and 145 s at 45 C. Those are examples from one setup, not universal benchmarks. The quantitative link between reduction rate and metabolically active yeast under controlled conditions is supported by dedicated reduction studies, including work indexed as PMID 25773544 and the mechanistic study in Yeast (2014).
Time course demonstration (original asset)
The table below is an original demonstration produced for this article using the AQA style setup described above: 2 mL yeast glucose mixture plus 2 mL working dye near 0.001%, one 10 second shake, then undisturbed incubation. Entries are example readings in the format a student group should record, with the rate index defined as 1 divided by decolorisation time in seconds. Run the same tubes and replace these entries with measured values.
| Tube | Temperature | Time to full decolorisation (s) | Rate index (1/s) | Observation |
|---|---|---|---|---|
| A | 20 C | 275 | 0.0036 | Slow fade, blue lingers at meniscus |
| B | 35 C | 128 | 0.0078 | Fastest, uniform loss of colour |
| C | 45 C | 145 | 0.0069 | Slightly slower than 35 C, heat stress onset |
| D (boiled yeast control) | 35 C | No change at 600 s | 0 | Stays blue, cells inactive |
| E (no glucose control) | 35 C | 340 | 0.0029 | Slow fade on endogenous reserves |
| F (no yeast blank) | 35 C | No change at 600 s | 0 | Stays blue, no chemical reduction |
Plot the rate index against temperature for tubes A, B, and C. The curve rises then flattens or falls, which is the expected enzyme driven pattern, not a straight line. Tubes D, E, and F are not data points on that curve. They are the controls that make the curve interpretable.
Controls that make each assay mean something
Every respiration run needs three companions. Boiled or killed yeast plus glucose plus dye should stay blue, proving fast reduction depends on living metabolism. Live yeast plus dye without added glucose is a substrate control, but expect slow decolorisation anyway since yeast burns endogenous reserves. Glucose plus dye with no yeast is the chemical blank, essential because alkaline glucose can reduce methylene blue without any cells present.
Viability counting needs a different kind of control: procedural constancy. Same dye stock, same mix ratio, same stain interval, same chamber area, same bud and boundary rules, counted blind where possible. When two operators disagree by ten points, the worksheet usually reveals the cause: different timing, different blue threshold, or different bud rules. The techniques for preparing and viewing stained cells connect to simple bacterial staining methods, while a broader survey of what the dye marks across specimens sits in the microscopy staining atlas. For the physics behind reading any blue intensity quantitatively, the condition labelled absorption reference explains why each coefficient must travel with its solvent, pH, and concentration conditions.
Choose the assay by the question. How many cells are alive right now is a counting question, answered at the microscope with a worksheet. How actively is this culture respiring is a kinetic question, answered with a stopwatch and controlled tubes. Methylene blue serves both, but never in the same tube at the same time.