
Article
Methylene blue degradation and photocatalysis: interpreting removal results
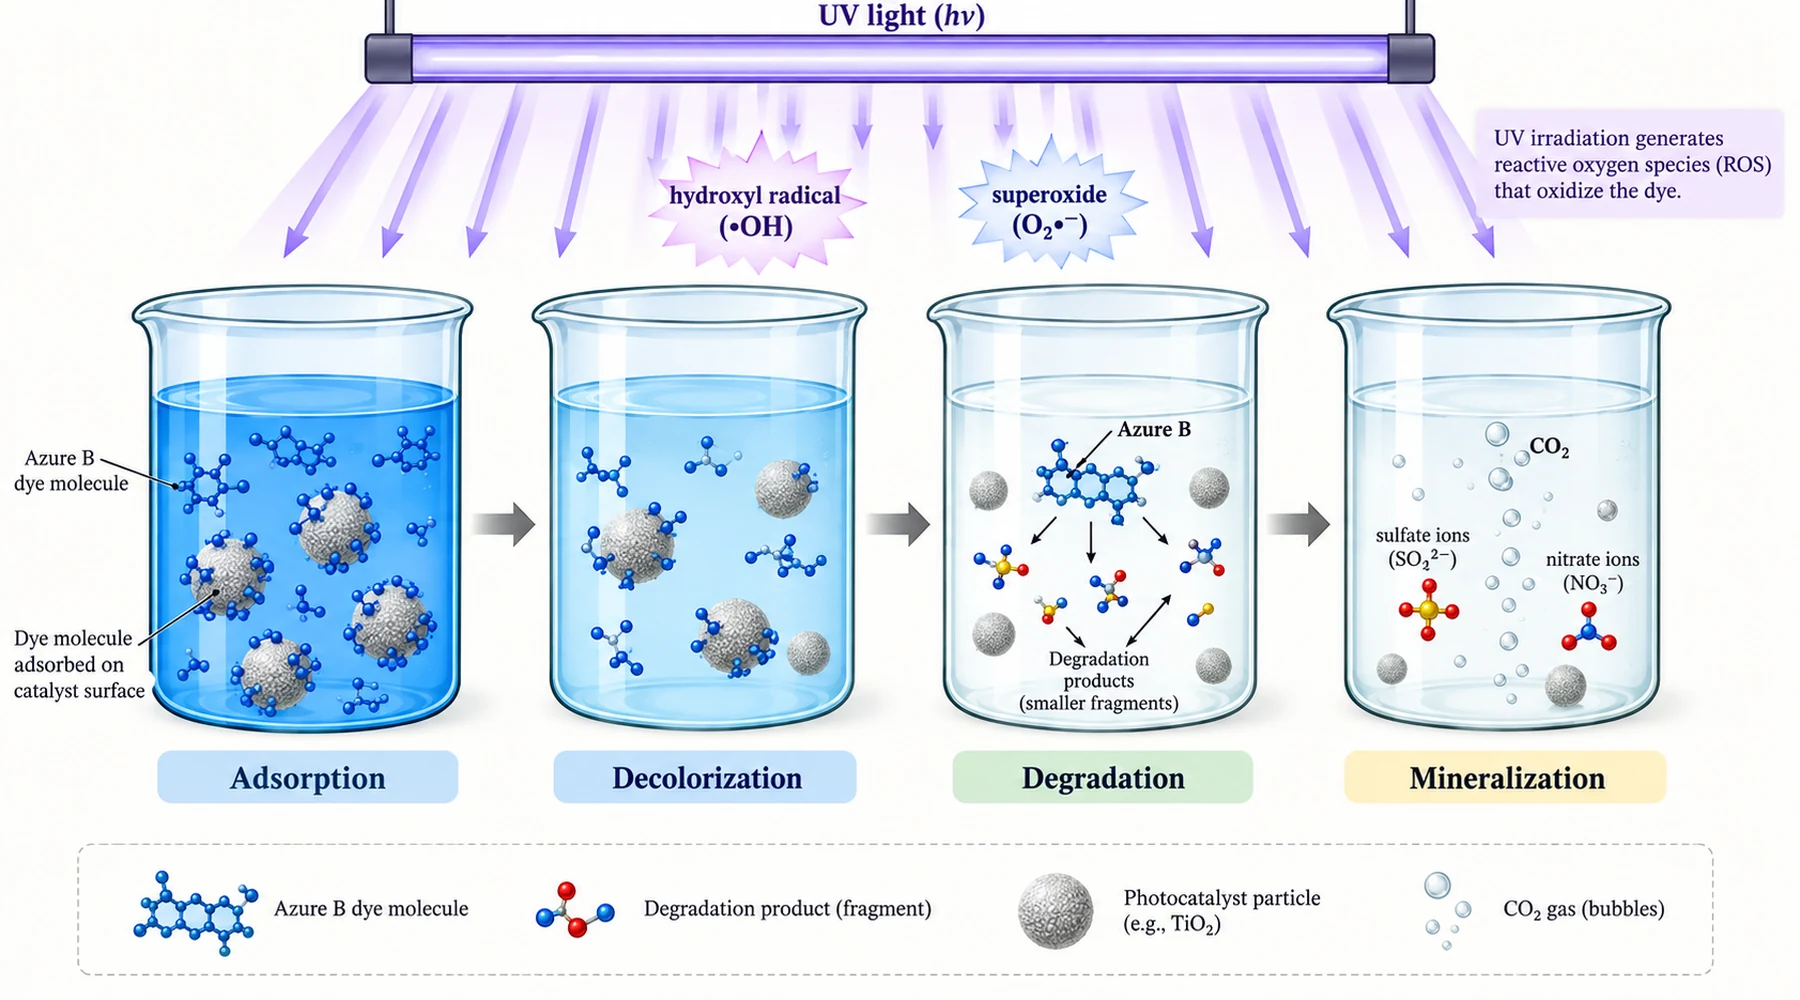
A laboratory tests two catalysts for the photocatalytic degradation of methylene blue. Catalyst A clears 95 percent of the blue color in one hour. Catalyst B manages only 60 percent. The team declares A the winner, writes it into a report, and orders more of it. Months later, a carbon analysis shows the truth: most of the dye removed by A was sitting intact on the solid surface, while B had actually broken more dye molecules apart. The ranking was backwards because the team measured one concept and named it as another.
This mistake is common because four different concepts share one observable: the blue liquid goes pale. Adsorption, decolorization, degradation, and mineralization can each produce that outcome, and each makes a different claim about what happened to the dye. Methylene blue is one of several analytical and environmental applications where the dye plays a defined role, and here its role is the model pollutant being removed or transformed. Before comparing catalysts or publishing a removal percentage, decide which endpoint your measurements can actually support.
Four endpoints, four different claims
Think of these as four concepts with different operational principles. Each answers a different question, and each demands its own evidence.
Adsorption means dye molecules leave the solution and rest on the solid without necessarily changing chemically. The test for it runs in the dark until uptake reaches a genuine plateau, and the honest evidence includes dye recovered from the solid by desorption or extraction. A fixed 30 minute dark period is not proof of equilibrium for every material, and a recent methodological discussion shows how skipping this step produces false catalyst rankings when dark uptake differs between materials.
Decolorization means loss of the visible chromophore, usually tracked near the main absorption band around 664 nm. Adsorption, reduction, N-demethylation, and chromophore cleavage can all lower that reading, so a single wavelength value cannot identify the cause. Record full spectra instead of one number: a blue shift in the peak is consistent with demethylated products of the Azure family. A result stated as 95 percent removal at 664 nm should be called 95 percent decolorization, not 95 percent degradation.
Degradation means the parent methylene blue molecule has been chemically transformed. The evidence is chromatographic: intact dye disappears on HPLC or UPLC while transformation products appear and then themselves decay, ideally identified by LC-MS. Useful markers include the molecular ion near m/z 284 for the parent and the stepwise demethylation series Azure B near 270, Azure A near 256, Azure C near 242, and thionine near 228, for which validated LC-MS/MS transitions for dyes in water are published.
Mineralization means organic carbon has been converted to inorganic end products, principally carbon dioxide and inorganic carbon, with nitrogen and sulfur ending in species such as ammonium, nitrate, and sulfate. Total organic carbon (TOC) loss is the routine carbon measure. Chemical oxygen demand (COD) reduction shows a falling oxidizable load but is not a carbon mass balance and does not by itself establish complete mineralization. Ion chromatography for sulfate, nitrate, and ammonium strengthens the claim.
| Endpoint | Question answered | Minimum supporting measurement |
|---|---|---|
| Adsorption | How much dye moved onto the solid unchanged? | Dark uptake to plateau plus solid-phase recovery |
| Decolorization | How much visible color disappeared? | Full UV-vis spectra, reported as color loss only |
| Degradation | How much parent dye was chemically transformed? | Chromatographic loss of intact dye plus product data |
| Mineralization | How much organic carbon became inorganic? | TOC loss with blanks, plus inorganic ions where claimed |
Catalyst variants (doped titania, composites, carbon supported materials, and similar) belong in one comparison only when every variant passes through the same endpoints and controls. A composite that adsorbs strongly will always look fast on a color test, which is exactly why the checklist below separates uptake from reaction before any ranking.
The mechanism of photocatalytic degradation of methylene blue
The accepted pathway family for genuine semiconductor excitation is summarized in a widely cited review of photocatalytic dye degradation on titania-based materials. Absorbed photons create conduction band electrons and valence band holes. Holes oxidize surface water or hydroxide to hydroxyl radicals, while electrons reduce dissolved oxygen to superoxide, with further chemistry through hydroperoxyl radicals and hydrogen peroxide producing additional hydroxyl radicals. These reactive oxygen species and the holes themselves then attack the dye.
Methylene blue transformation typically begins with sequential N-demethylation through Azure B, Azure A, and Azure C toward thionine, alongside oxidation of the phenothiazine chromophore. Further radical attack breaks carbon sulfur and carbon nitrogen bonds, opens the aromatic rings, and yields phenolic and aniline type compounds, aldehydes, and low molecular weight carboxylic acids before eventual mineralization. A dedicated review of methylene blue properties and photodegradation pathways maps this family in detail. Exact branch ratios depend on catalyst, pH, oxygen supply, and irradiation, so treat the scheme as a pathway family rather than one compulsory sequence.
Two experimental factors deserve attention because they change apparent kinetics without changing the intrinsic catalyst. pH shifts the titania surface charge and surface hydroxylation, which alters adsorption of the cationic dye and therefore the observed rate; compare materials at matched pH and record initial and final values. Dissolved salts and buffers act similarly: chloride, phosphate, carbonate, and sulfate can occupy surface sites and reshape radical chemistry, and a focused study of inorganic salts in titania photocatalysis documents the effect on methylene blue directly.
The visible-light trap
Pristine titania needs near-UV excitation, yet many reports show methylene blue bleaching under visible-only lamps and credit the catalyst with visible-light activity. The likely mechanism is dye sensitization: the excited dye injects an electron into the semiconductor, and that electron reduces oxygen, bleaching color without genuine band-gap excitation of the solid. Experimental work archived by Ohtani and colleagues on the visible-light problem demonstrated the artifact, and the scope statement of ISO 10678 makes the boundary explicit by restricting its methylene blue test method to UV irradiation and excluding visible-light activity claims.
The practical test is simple. Repeat the experiment with a colorless probe that does not absorb visible light, and compare the wavelength dependence of the rate against the absorption spectrum of the catalyst. If activity follows dye absorption rather than catalyst absorption, the result supports sensitization, not intrinsic visible-light photocatalysis. Keep this test in mind when reading vendor claims about visible-light catalyst variants.
Endpoint checklist
Use this list before ranking catalysts or writing a removal claim. It is the reusable asset for this page: every methylene blue degradation experiment should pass every line.
- Dark adsorption control: dye plus catalyst, no light, stirred to a measured plateau with solid-phase recovery, not a fixed-time assumption.
- Photolysis control: dye plus light, no catalyst, to quantify direct bleaching under your lamp and geometry.
- Analytical blank: catalyst plus light, no dye, to capture background signals in TOC, ions, and spectra.
- Fixed reaction conditions: lamp spectrum, photon flux, temperature, mixing, dissolved oxygen, reactor geometry, initial dye concentration, catalyst loading, pH, and matrix held constant across variants.
- Solid separation before spectroscopy: filter or centrifuge so scattering is not read as absorbance.
- Full spectra, not one wavelength: report the scan so peak shifts and new bands stay visible.
- Chromatographic confirmation for any degradation claim: loss of intact parent plus tracked products.
- Carbon accounting for any mineralization claim: TOC with blanks, and a check that carbon counted as gone has not simply moved onto the solid.
- Leaching check: remove the solid completely (a hot-filtration style test), irradiate the filtrate, and analyze dissolved metals; continued reaction implicates a homogeneous contribution.
- Honest naming: call a 664 nm result decolorization, a chromatographic result degradation, and a TOC result mineralization.
A contemporary UV-LED photoreactor study combining adsorption tests, catalyst separation, UV-vis, and TOC shows how these layers fit together in one methods section.
Worked mass-balance example
Suppose a 100 mL test starts at 10 mg/L methylene blue, so the reactor holds 1.0 mg of dye. After dark equilibration the solution reads 8.0 mg/L, meaning 0.2 mg sits on the solid and 0.8 mg remains dissolved. After one hour of irradiation, filtered solution analysis gives 2.0 mg/L intact dye by chromatography (0.2 mg in solution), desorption recovers 0.1 mg of intact dye from the solid, and TOC shows 40 percent of the initial organic carbon has left the combined solution-plus-solid system as inorganic carbon.
The carbon-basis balance reads: initial carbon equals parent dye in solution plus parent dye adsorbed plus organic intermediates plus mineralized carbon. Here 20 percent of the initial dye mass persists as intact parent (0.2 mg across both phases), 40 percent is mineralized, and the remaining 40 percent is organic transformation products (intermediates in solution or on the solid, confirmed by the product peaks). The correct report is 80 percent parent-dye degradation with 40 percent mineralization, not 95 percent anything. Note the trap: if TOC had been measured on filtered supernatant alone, adsorbed organics would have counted as destroyed and inflated the mineralization figure. Measure whole-slurry carbon where feasible or add the solid-bound fraction back explicitly.
Reporting rule
State the weakest endpoint your evidence supports, then add stronger claims only as each measurement layer passes. Methylene blue degradation work earns trust the same way the other dye-based methods do: by matching the result to the property the method truly measures. A companion guide to reading dye-based research claims extends the same discipline to study design, and a practical protocol for checking test conditions covers calibration habits that transfer directly to photoreactor work.