
Article
Measuring methylene blue's mitochondrial effects: oxygen, ATP, and membrane potential
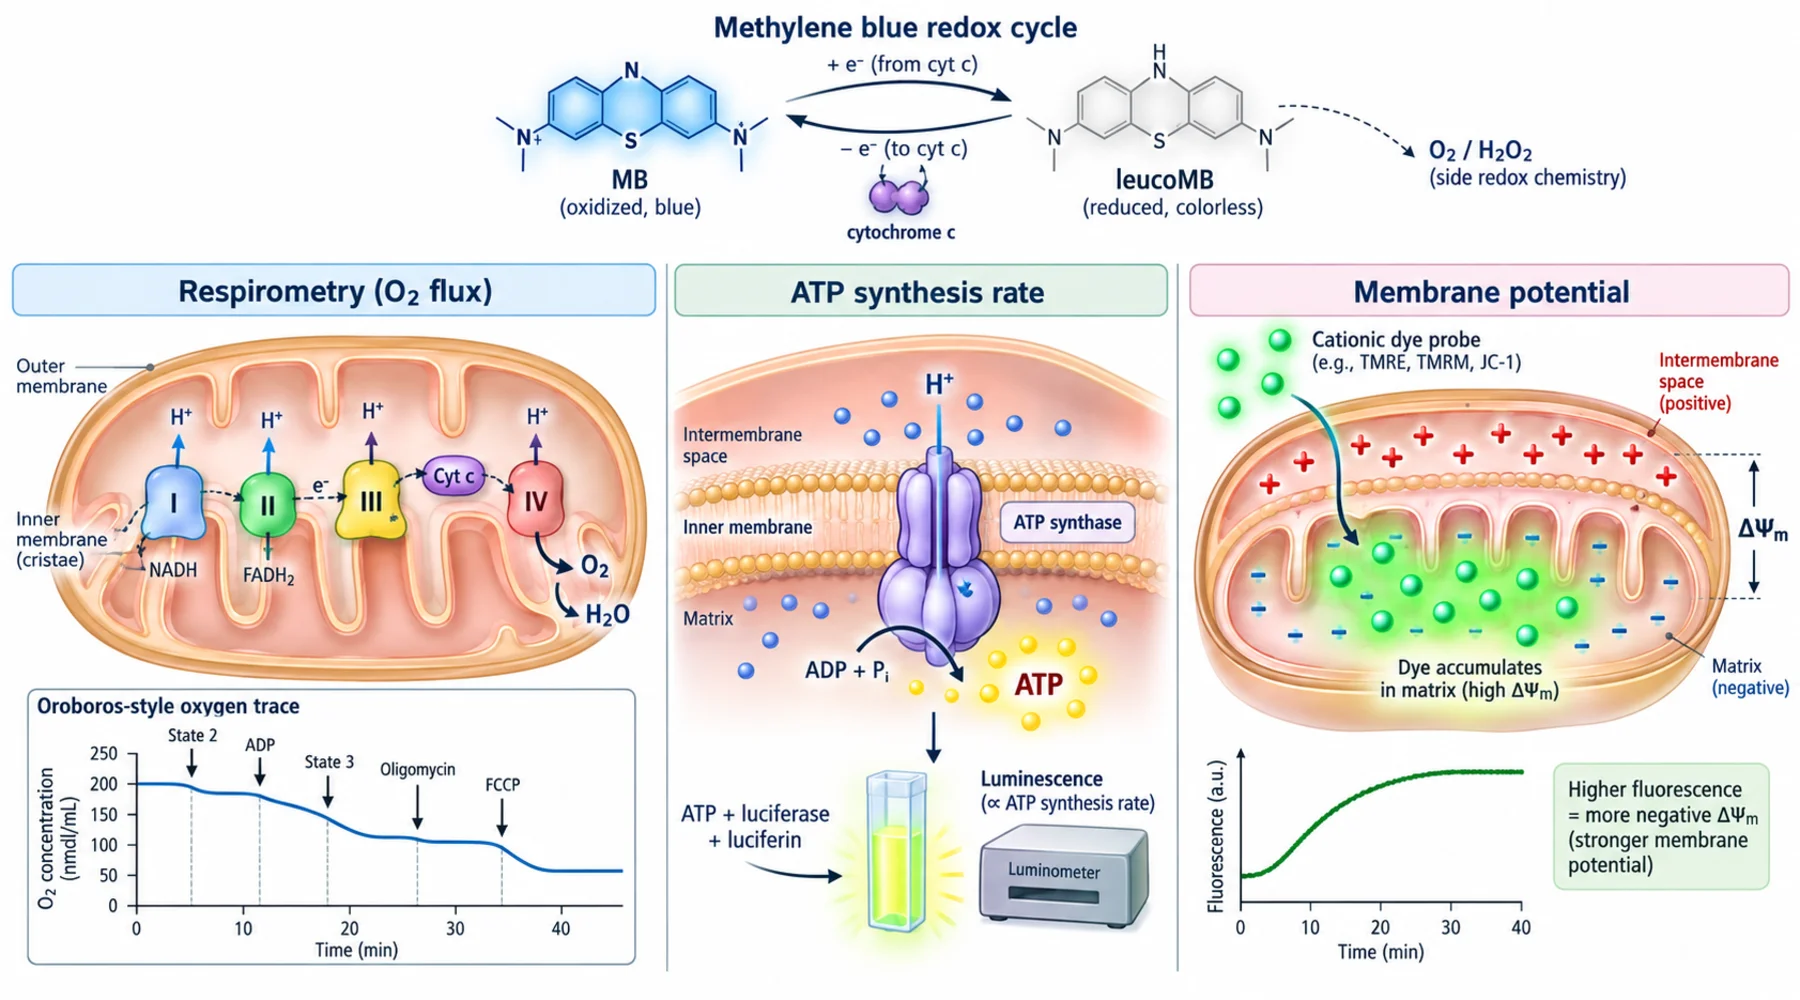
Suppose a lab adds methylene blue to respiration-impaired mitochondria and watches oxygen consumption rise. The natural sentence to write is that the dye restored mitochondrial function. That sentence may be wrong. Oxygen flux, ATP synthesis, and membrane potential are three distinct concepts. They share the same organelle the way backup, sync, and sharing share the same cloud folder: related, but governed by different rules. Confuse one for another and the interpretation fails, even when every measurement is technically correct.
Methylene blue makes the confusion likely because it participates in the system it measures. It is a redox cycler that accepts electrons upstream and donates them downstream, a lipophilic cation that accumulates in energized mitochondria, and a strongly blue compound that absorbs and emits light in the same bands as common probes. A single readout cannot carry that load. The reliable pattern, shown across the Budapest mitochondrial studies, is to measure oxygen flux plus ATP synthesis rate plus membrane potential plus hydrogen peroxide release, with dye-specific controls at each step.
Respirometry measures oxygen flux, not energy output
High-resolution respirometry, whether by Oroboros Oxygraph or Seahorse extracellular flux analyzer, reports one thing: how fast oxygen is being reduced. It does not report how many protons were pumped per electron, how much gradient was conserved, or whether ATP synthase used it.
The vocabulary matters. In isolated mitochondria, substrate without ADP gives leak respiration, substrate with saturating ADP gives oxidative phosphorylation capacity, and uncoupler titration gives maximum electron transfer capacity. In intact cells the Seahorse equivalents are basal respiration, oligomycin-sensitive ATP-linked respiration, proton leak, FCCP-defined maximal respiration, and rotenone plus antimycin resistant non-mitochondrial oxygen consumption. Calling Seahorse outputs State 3 and State 4 borrows a precision the preparation does not support, as the Agilent Mito Stress Test framework makes clear.
Methylene blue breaks the intuitive link between more oxygen and more energy. In isolated guinea pig brain mitochondria, 100 nM to 1 uM dye raised resting oxygen consumption with glutamate plus malate, succinate, and alpha-glycerophosphate substrates, with roughly a 64 percent rise on alpha-glycerophosphate, yet ADP-stimulated respiration in healthy mitochondria was essentially unchanged, according to the isolated brain mitochondria study. Because leak rose while ADP-stimulated flux stayed flat, the computed respiratory control ratio falls. That fall does not mean the dye damaged the mitochondria. It means the dye added an oxygen-consuming redox cycle on top of normal respiration. A methylene blue oxygen consumption assay that reports only the rise has measured real chemistry and said nothing about energy conservation.
The rescue experiments show the same gap at larger scale. With Complex I blocked, oxygen flux recovered roughly threefold while ATP synthesis recovered only about 1.5-fold. More oxygen reached the electrode. Less of it paid for ATP. Any claim of improved oxidative phosphorylation needs the ATP side of the ledger, ideally expressed as an ATP per oxygen ratio with the denominator convention stated.
ATP assays measure synthesis rate, which content cannot substitute
An ATP assay answers a different question: how much ATP is generated per unit time. A kinetic readout, either firefly luciferase luminescence tracked over minutes or a coupled hexokinase plus glucose-6-phosphate dehydrogenase assay read at 340 nm, yields a rate. A single endpoint total ATP measurement yields content, which reflects synthesis minus consumption and tells you little about oxidative phosphorylation on its own.
The Budapest group used the coupled enzymatic method with adenylate kinase suppressed, and found that methylene blue at 1 to 2 uM modestly but significantly raised ATP production in rotenone-treated and antimycin-treated mitochondria. That is genuine rescue, and it is partial. The TEGDMA toxicity study reached the same shape of answer in a different model: 5 mM dental monomer TEGDMA collapsed Complex I linked respiration from roughly 286 to 28 flux units, and 2 uM dye restored it to roughly 86.
Two controls are non-negotiable with a colored redox compound. First, run oligomycin to establish how much of the measured ATP synthesis depends on ATP synthase. Second, run a cell-free spike recovery with known ATP plus complete reagent plus the exact dye concentrations used, at minimum 0, 100 nM, 300 nM, 1 uM, and 2 uM. The dye can absorb emitted light, inhibit the reporter enzyme, or alter reagent redox chemistry, and general luciferase assay guidance recommends biochemical counterscreens for exactly this class of interference. Do not assume 1 uM is artifact-free because quenching is usually worse at higher concentrations.
Membrane-potential probes measure dye distribution, not flux
Safranine O, TMRM and TMRE, rhodamine 123, and JC-1 are all membrane-permeant cations. They accumulate in the negatively charged matrix according to electrochemical equilibrium, so bulk fluorescence reports the potential indirectly through where the probe sits. None of them measures ATP or electron flux.
Each probe has a preferred preparation. Safranine O suits isolated mitochondria and permeabilized cells, typically near 2 uM with excitation near 495 nm and emission near 585 nm, operating in a quenching regime where uptake changes bulk fluorescence. TMRM and TMRE suit intact cells at low nanomolar loading in non-quenching mode, where depolarization releases dye and mitochondrial fluorescence falls; at high loading the direction of the signal can invert through self-quenching. JC-1 gives a convenient green to red ratio but depends on loading and mitochondrial mass, which makes it weaker for quantitative work than carefully controlled TMRM. These trade-offs are summarized in a widely used review of mitochondrial membrane potential probes.
Methylene blue interferes optically at exactly the working concentrations. Its absorption bands near 600 to 665 nm overlap red probe emission, so inner-filter effects, quenching, and absorption of excitation light are all credible. The dye is also a second lipophilic cation whose own distribution changes with the potential being measured. The defense is redundancy plus blanks: probe alone, dye alone, probe plus each dye concentration, full depolarization with FCCP as the zero reference, and ideally a second optically distinct probe. The Complex III bypass study set that precedent by repeating the membrane potential rescue with both safranine O and TMRM after antimycin and myxothiazol inhibition and obtaining the same qualitative recovery. One optical reporter is a hint. Two independent reporters are evidence.
Three preparations, three different questions
Isolated mitochondria, permeabilized cells, and intact cells are not interchangeable sensitivity settings on one assay. They are different concepts with different operational principles.
Isolated mitochondria preserve the electron transport chain, inner membrane, and matrix machinery while removing the plasma membrane, cytosol, and network architecture. That removal is the point: substrates, ADP, inhibitors, and dye concentrations are defined exactly, so a pathway can be assigned. The cost is loss of native substrate supply, signaling, and demand.
Permeabilized cells keep mitochondria inside much of their cellular architecture while letting exogenous substrates and ADP through the opened plasma membrane. They are the right tool for assigning a substrate-pathway defect inside a cellular context. Over-permeabilization damages the outer membrane, and cytosolic regulation washes out.
Intact cells preserve everything: plasma membrane barrier, cytosolic reductants, endogenous substrate transport, mitochondrial network, and ATP demand. They are closest to physiology and furthest from mechanism, because dye uptake, reduction, and sequestration all shape the effective mitochondrial exposure.
The TEGDMA study used all three levels deliberately: isolated brain mitochondria for dye rescue of oxidation and potential, permeabilized dental pulp stem cells mainly to localize the lesion to Complex I linked substrate oxidation, and intact stem cells for the physiological net effect of 2 uM dye on suppressed oxygen consumption. For readers comparing mitochondrial readouts across preparations, the companion explainer on how methylene blue moves electrons through the respiratory chain gives the pathway background, and the guide to reading methylene blue respiration studies covers dose and inhibitor logic.
Controls a redox-active dye demands
A redox cycler needs a longer control list than an ordinary inhibitor, because dye-only chemistry can mimic biology.
For respirometry, run a buffer-only chamber for drift, a buffer plus dye chamber without biological material, dye plus any extracellular reductant present in the assay, and terminal rotenone plus antimycin to define non-mitochondrial oxygen consumption in intact cells. Note that reduced dye reoxidizes by transferring electrons to oxygen to form hydrogen peroxide, so a dye-only blank without an electron donor underestimates the cell-free oxygen sink that appears once NADH or NADPH is available.
For hydrogen peroxide, prefer calibrated Amplex UltraRed plus horseradish peroxidase over nonselective DCFDA dyes, verify with catalase, and test illumination dependence, since the dye is a photosensitizer. The brain mitochondria study found the peroxide burden rose more than fourfold at just 100 nM dye while elimination slowed, with peroxide formed directly by reduced dye without a superoxide intermediate. Details of probe choice and light controls belong to the companion piece on measuring reactive oxygen species in dye experiments, and the broader question of when peroxide acts as signal versus burden is covered alongside cellular redox balance and antioxidant claims.
For pathway claims, test both Complex III inhibitor sites: antimycin A at the Qi site and myxothiazol at the Qo site, plus a Complex IV endpoint with cyanide. An earlier mouse brain study reported dye rescue of rotenone-blocked but not antimycin-blocked respiration, while the later three-species study found partial rescue with both inhibitors and evidence of direct cytochrome c reduction. Treat the bypass as compatible with the newer data rather than settled, since dye concentration, inhibitor site, substrate state, and dye distribution all shift the observed route.
Assay-selection matrix
Use this table to pick the measurement from the question, not the other way around.
| Biological question | Best assay | Preparation | Key control | Common confounder |
|---|---|---|---|---|
| Does the dye restore electron flux? | Oroboros or Seahorse oxygen consumption with defined substrate and inhibitor protocol | Isolated mitochondria for pathway mapping; intact cells for net effect | Dye-only oxygen blank; terminal rotenone plus antimycin | Redox cycling consumes oxygen without making ATP |
| Does the dye restore ATP synthesis? | Kinetic ATP synthesis rate, luciferase or coupled enzymatic assay | Isolated mitochondria or controlled permeabilized cells | Oligomycin; known-ATP plus dye spike recovery | Reporter inhibition and optical attenuation; content mistaken for rate |
| Is the rescue energetically efficient? | Parallel oxygen flux plus ATP rate; report ATP per oxygen | Isolated mitochondria or permeabilized cells | Same substrates and ADP across both readouts | Dye to oxygen to peroxide flux inflates the denominator |
| Does the dye restore membrane potential? | Safranine O in isolated mitochondria; low-loading TMRM in cells; second probe when possible | Match probe to preparation | FCCP full depolarization; dye-only spectral scan | Absorption and quenching near 600 to 665 nm; shifting dye distribution |
| Is the defect at Complex I? | Respirometry with glutamate plus malate or pyruvate plus malate versus succinate | Isolated or permeabilized | Rotenone reference; succinate comparison | Dye provides an alternate route, so Complex I activity may read as restored when it was bypassed |
| Is the defect at Complex III? | Respirometry with antimycin A and myxothiazol separately, plus potential in parallel | Isolated mitochondria | Both Qi and Qo site inhibitors; Complex IV endpoint | Dye redox state and compartment distribution decide the route |
| Does the dye raise the peroxide burden? | Amplex UltraRed plus peroxidase, calibrated; orthogonal sensor in cells | Match to the question being asked | Catalase; no-peroxidase; dark versus light control | The dye itself redox-cycles and photosensitizes peroxide formation |
The minimum convincing claim runs the same dye concentrations, 100 nM, 300 nM, 1 uM, and 2 uM, through oxygen flux under leak, ADP, oligomycin, and uncoupler conditions, ATP synthesis rate, membrane potential with preferably two probes, and calibrated peroxide release with catalase and cell-free controls. Report the linked set: oxygen flux plus ATP rate plus ATP per oxygen plus potential plus peroxide. Any one of those numbers alone is a measurement looking for a meaning.