
Article
Methylene blue and autophagy: AMPK, mTOR, and neuronal experiments
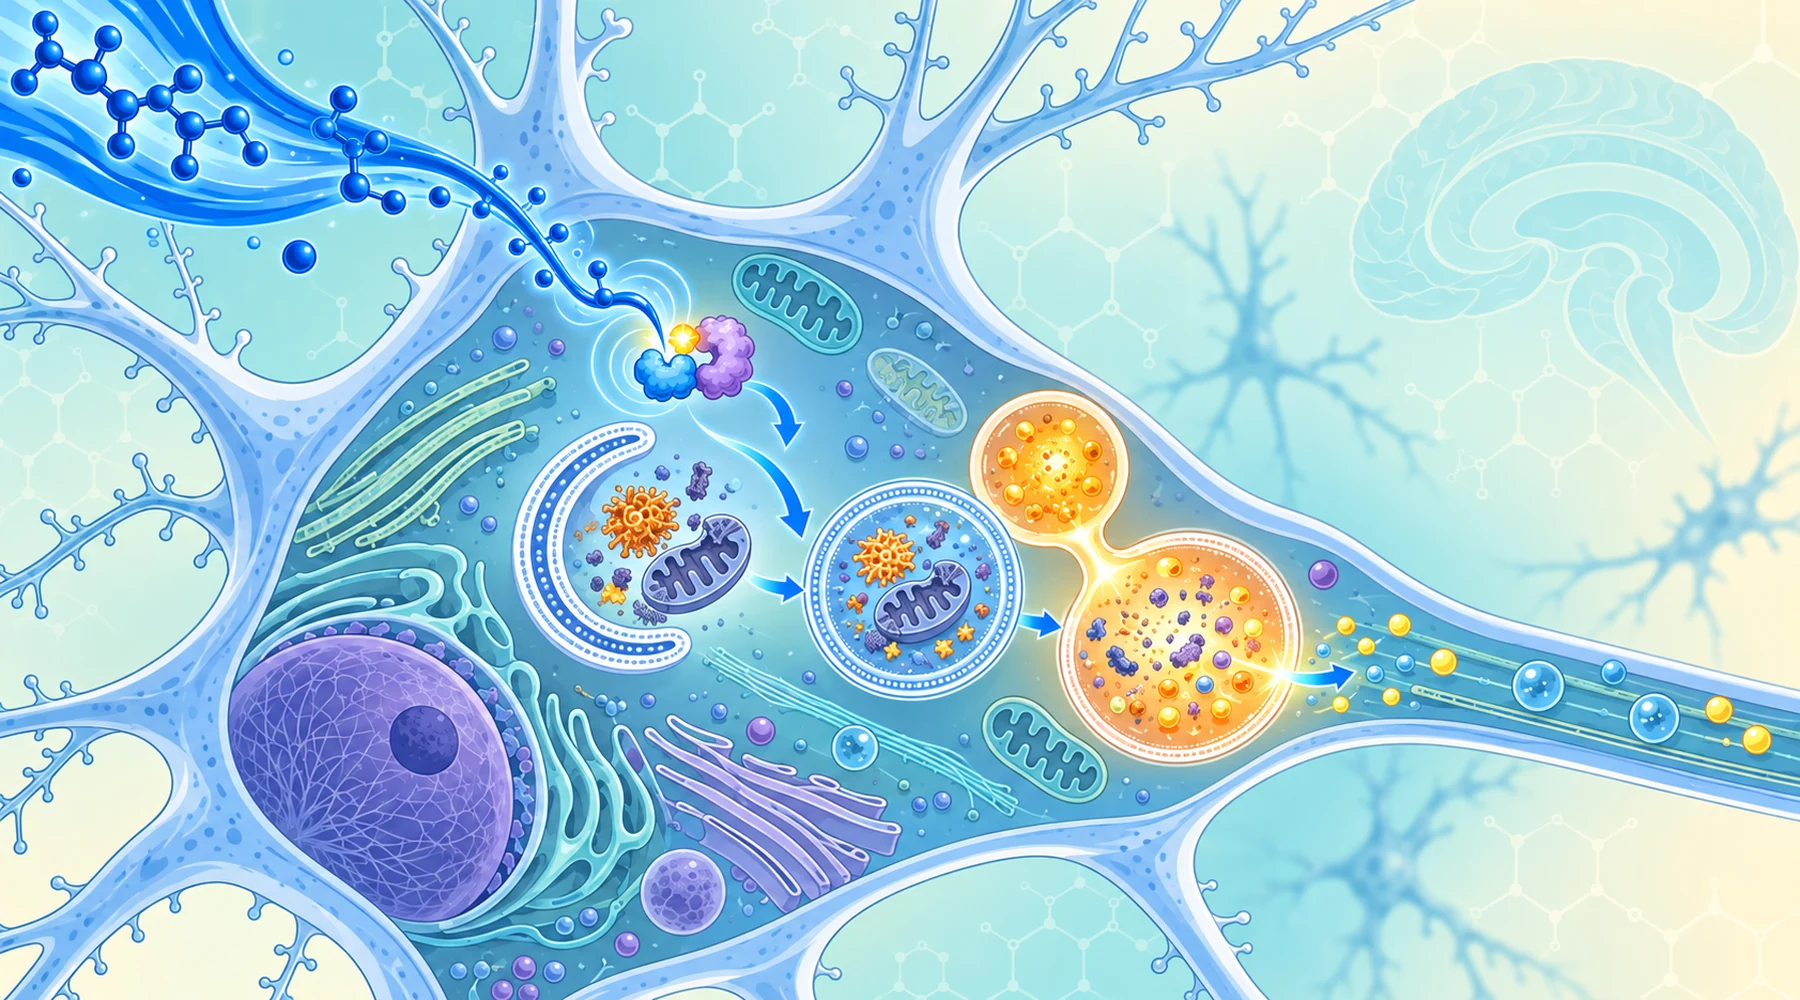
Imagine you run a cell experiment, add methylene blue, and see a protein band called LC3-II grow darker on your blot. It is tempting to announce that the compound "boosts autophagy" and move on. That reading is premature. A darker LC3-II band can mean the cell is building more cleanup vesicles, or it can mean the vesicles are piling up because the disposal step is jammed. The two interpretations point in opposite directions, and the neuronal methylene blue literature contains examples of each kind of evidence. This article walks through what was actually measured, assay by assay.
Macroautophagy, the form studied here, is the cell's bulk recycling concept. A membrane sac called a phagophore grows around worn-out proteins and organelles, closes into an autophagosome, fuses with a lysosome, and its cargo gets degraded and released for reuse. Neurons depend on this routine because they do not divide and cannot dilute damaged parts by splitting. When recycling stalls, waste accumulates. When it runs, the cell recovers building blocks under stress.
What one hippocampal experiment showed
The central induction study used HT22 mouse hippocampal cells stressed by serum deprivation for 24 hours, a condition that withdraws growth factors and trophic signals and triggers both apoptosis and autophagy. The researchers reported that methylene blue reduced cell death in a dose-dependent manner, and that this protection came accompanied by signs of macroautophagy.
The marker trail was specific. Diffuse LC3B staining redistributed into perinuclear puncta starting around 20 nM methylene blue, with the strongest LC3-I and LC3-II response near 1 μM. Both LC3B-I and LC3B-II rose in a dose- and time-dependent way. Crucially, the team went one step beyond a static LC3 blot. They added 10 μM chloroquine, which blocks lysosomal clearance, and found higher LC3-II plus stabilized p62 in methylene blue treated cells. That pattern supports lysosome-dependent turnover rather than a mere pileup. They also showed that chloroquine partially reversed the anti-apoptotic effect, which ties the protection to the autophagy and lysosome pathway in this model.
The signaling result is the part most often misquoted. AMPK signaling, read out as phosphorylated AMPK and its downstream target phosphorylated ACC, rose at 12 and 24 hours in a dose-dependent manner. The AMPK inhibitor Compound C, applied at 20 μM during the final 4 hours, reduced both ACC phosphorylation and LC3 activation. Phosphorylated mTOR, by contrast, showed no detectable suppression. So in stressed hippocampal cells, the finding was AMPK-linked induction through an apparently mTOR-independent route. The same pattern appeared in living mice, where methylene blue treatment induced macroautophagy markers in cortex and hippocampus.
Induction is not completed flux
Here the concept distinction matters most. Induction means the upstream machinery makes more autophagosomes. Flux means cargo travels the whole route: sequestration, maturation, lysosome fusion, degradation, recycling. Every LC3-II increase is an induction claim until a flux test confirms the rest of the journey.
The standard flux test measures LC3-II with and without a short lysosomal blockade such as bafilomycin A1 or chloroquine. If the treatment genuinely accelerates production, blocking destruction should push LC3-II higher still. A tandem mCherry-GFP-LC3 reporter adds a second angle: structures glow yellow before lysosome fusion and red-only after acid quenches the GFP signal, so more red-only puncta support progression into acidic autolysosomes. Falling p62 protein can corroborate cargo turnover, with the caveat that p62 transcription itself responds to stress and should be checked at the mRNA level.
The checklist below maps each assay used in this literature to what it measures and what it cannot prove alone. Readers can reuse it on any future macroautophagy claim, including fasting and longevity arguments that borrow these markers.
| Assay | What it measures | What it cannot prove alone |
|---|---|---|
| LC3B-I level | Size of the cytosolic precursor pool available for lipidation | Autophagy activity; synthesis and processing also change it |
| LC3B-II level | Amount of membrane-bound LC3 on autophagic structures | Completed flux; a rise can mean faster production or blocked clearance |
| LC3 puncta and perinuclear aggregation | Redistribution of LC3 into vesicular structures | Direction of change; static images cannot separate acceleration from a traffic jam |
| LC3-II with versus without chloroquine or bafilomycin A1 | Whether new autophagosomes keep forming when clearance is blocked | Full cargo degradation; short, optimized inhibitor exposure is required |
| p62 protein level | Turnover of a cargo adaptor normally destroyed in autolysosomes | Pure flux; stress pathways also regulate p62 transcription |
| Tandem mCherry-GFP-LC3 reporter | Progression into acidic autolysosomes (yellow to red-only shift) | Complete degradation of every cargo type |
| Phospho-AMPK and phospho-ACC | Engagement of the energy stress sensor and its output | That autophagy caused the survival effect; AMPK controls many metabolic branches |
| Phospho-mTOR, p70S6K, 4EBP1 | Activity of the growth signaling route that restrains autophagy | Flux; these are upstream permission signals, not disposal readouts |
Note one wording trap the table guards against. Phosphorylated ACC is the enzymatically inhibited form. Its rise demonstrates AMPK output, not ACC activation.
The phrase "macroautophagy inhibition abolished neuroprotection" deserves the same precision. In the HT22 model it means that interfering with the autophagy and lysosome pathway removed methylene blue's survival advantage under serum deprivation. It supports autophagy as necessary or contributory in that dish. It does not establish autophagy as the compound's only protective mechanism, it does not prove chloroquine acts exclusively through autophagy, and genetic perturbation of ATG5, ATG7, or ULK1 would be needed to harden the causal claim.
Two routes into the same machinery
A simplified map helps. Energy stress pushes AMPK up, AMPK activates the ULK1 complex, and autophagy starts. Growth factors and nutrients push mTORC1 up, mTORC1 inhibits ULK1, and autophagy stays off. Downstream of ULK1, the Beclin-1 and VPS34 complex nucleates the phagophore, LC3-I gets lipidated to LC3-II, the autophagosome closes, fuses with the lysosome, and cargo is degraded with p62 turning over.

The diagram places each methylene blue finding on this map: the hippocampal result beside the AMPK branch, the progenitor result beside the mTOR branch.
This framing resolves the apparent tension with the second Xie study. In proliferating rat neural progenitor cells, a separate experiment found that 5 μM methylene blue inhibited proliferation and promoted quiescence, with Ki67 positive cells falling at days 1 and 3, while committed neuronal differentiation stayed intact. There the mechanism ran through suppressed mTOR signaling: reduced total mTOR and phosphorylated mTOR alongside lower p70S6K and 4EBP1 expression, plus down-regulation of cyclins E1, B1, D1, and D2. The dominant phenotype was progenitor quiescence, which the authors linked to delayed senescence, not rescue of stressed hippocampal cells.
There is no contradiction between the two papers. AMPK and mTOR are context-sensitive integrators, not fixed switches. A stressed, neuron-like cell can engage AMPK without measurable mTOR inhibition, while a mitogen-driven progenitor can respond to the same compound by throttling mTOR-dependent growth machinery. Cell type, stress context, concentration, and timepoint decide which branch dominates. That is also why mitochondrial energy and redox effects of methylene blue belong in the same picture: as a mechanistic review of neuroprotection describes, the compound acts as an alternative electron carrier, engages antioxidant and anti-apoptotic signaling, inhibits MAO and NOS, and connects to mitochondrial renewal through biogenesis and autophagy. Autophagy is one branch of a pleiotropic profile, not the whole story.
What the experiments do not show
Serum deprivation models trophic and metabolic stress in a dish. It does not model whole-organism fasting: glucose, amino acids, and salts remain in the basal medium, and no feeding behavior exists. Culture concentrations from 20 nM to 5 μM cannot be converted into human doses by arithmetic, because absorption, protein binding, redox state, metabolism, tissue accumulation, and exposure time all differ.
No human trial has been designed to demonstrate methylene blue induced autophagic flux in patients. The mechanistic evidence remains cellular, ex vivo, and animal work, and reviews still describe translational evidence as preliminary. So these studies do not show that methylene blue reproduces fasting, extends human lifespan through autophagy, or completes autophagic flux in human brain. Fasting-mimetic and longevity claims need their own clinical evidence, and human methylene blue trials for other indications do not become autophagy trials by association. Research on nutrient-stress and longevity models should be read with that boundary in place.
For the next paper you read, apply the checklist in order. First ask which branch moved: AMPK, mTOR, or neither. Then ask whether the LC3 result was paired with a flux test or stands alone. Then check whether blocking the pathway removed the benefit, and by which method. A study that answers all three has earned a strong mechanistic claim. One that answers only the first has shown a permission signal, and the rest of the journey remains unmapped.