
Article
Methylene blue adsorption tests and activated carbon: running the test and reading the number
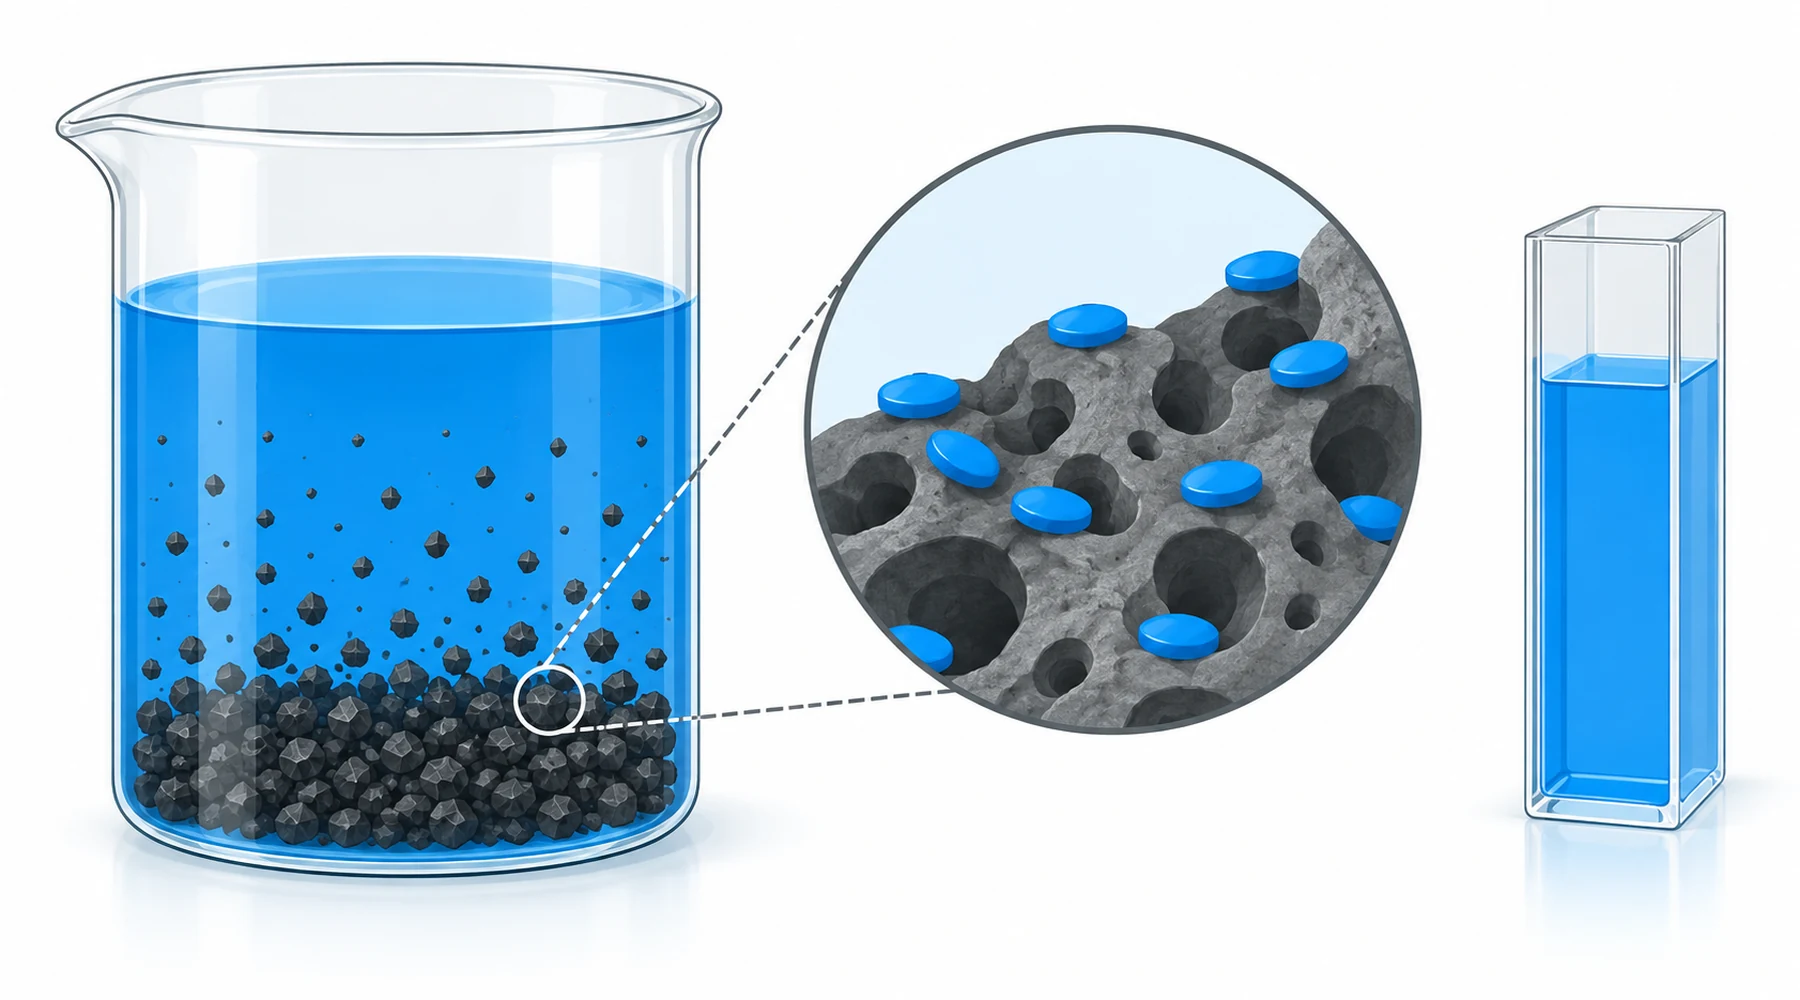
A lab compares two activated carbons. One datasheet claims a methylene blue value three times the other. The lab buys the larger number, doses by it, and the dye breaks through early. Nothing was falsified. The two numbers came from different tests, and the buyer read them as the same quantity.
This article fixes that reading error. It explains what the test measures, runs the calculation twice with real numbers, and names every variable that moves the result. The companion problem of ranking different adsorbents against each other is treated separately; here the subject is one material class and one method.
Why this dye is the probe
Methylene blue is a cationic, planar aromatic dye. In water it exists as a positively charged ion, and its molecular footprint is roughly 1.43 by 0.61 by 0.40 nm. That size is the point. Iodine, the other classic probe, is far smaller and slips into narrow micropores, so the iodine number tracks micropore development. Methylene blue needs wider doorways: it accesses pores above roughly 0.75 nm, with important contributions from pores around 1.4 to 3 nm. Those dimensions span larger micropores and small mesopores, so calling the test a pure mesopore probe oversimplifies it. The two probes complement each other. Iodine asks how much fine porosity exists. Methylene blue asks how much pore space admits a large organic molecule, which is the question that matters for dye removal. Neither number predicts uptake of other molecules on its own.
Charge matters as much as size. Because the dye is cationic, it is attracted to negatively charged surfaces and repelled by positively charged ones. That makes pH a first class variable rather than a footnote, as the experiments below show.
How the batch test runs
The standard laboratory form is a batch equilibration. Condition the carbon, sieve it to a controlled particle fraction, and weigh a known mass m. Add a known volume V of dye solution at starting concentration C0. Hold pH and temperature fixed, agitate for a verified time, then separate the carbon by filtration or centrifugation. Determine the remaining concentration Ce by UV-Vis absorbance, usually near 660 to 665 nm and often at 664 nm, against a calibration series prepared on the same instrument. One published procedure used 0.050 g of carbon with 50 mL of solution across 10 to 1000 mg/L, 24 hours at 25 C, readout at 660 nm. There is no single universal protocol, so a value reported without dose, concentration range, time, temperature, pH, and wavelength is not a result. It is a rumor.
Quantification itself deserves the same discipline described in absorbance based dye measurement: calibrate on your instrument, confirm the peak rather than assuming 664 nm, and dilute strong supernatants back into the linear range.
The worked calculation
Capacity comes from mass balance. Dye missing from solution sits on the carbon:
qe = (C0 minus Ce) times V divided by m
where qe is equilibrium uptake in mg/g, C0 and Ce are starting and equilibrium concentrations in mg/L, V is volume in liters, and m is carbon mass in grams.
First point. Start with C0 = 100 mg/L, V = 0.100 L, m = 0.0200 g. After equilibration the instrument reports Ce = 35 mg/L. Then qe = (100 minus 35) times 0.100 divided by 0.0200 = 65 times 0.100 divided by 0.0200 = 325 mg/g. Removal percentage is (100 minus 35) divided by 100 times 100 = 65 percent.
Second point, same dose and volume, higher loading. Start with C0 = 200 mg/L and measure Ce = 90 mg/L. Then qe = (200 minus 90) times 0.100 divided by 0.0200 = 550 mg/g, while removal is (200 minus 90) divided by 200 times 100 = 55 percent.
These two pairs, (Ce = 35, qe = 325) and (Ce = 90, qe = 550), are two points of an isotherm. Note the crossing behavior: capacity rose from 325 to 550 mg/g while removal fell from 65 to 55 percent. Capacity and removal percentage move in opposite directions as concentration rises. Anyone who ranks carbons by removal percentage measured at different doses or concentrations is ranking the experiment, not the material.
The variables you must control
Every entry below shifts the number. Fix each one or record it.
Dose. More carbon means more sites, so removal percentage rises while uptake per gram usually falls, because captured dye is spread over more mass. Report dose in g/L with the underlying V and m.
Initial concentration. Higher C0 supplies a larger driving force, so qe rises while removal percentage falls as sites saturate. Isotherms fitted over 5 to 50 mg/L and over 100 to 400 mg/L describe different curve regions. Compare fitted capacities only over overlapping ranges.
pH. For this cationic dye, uptake commonly rises with pH, especially above the carbon point of zero charge where the surface turns net negative. Low pH protonates surface sites and lets hydrogen ions compete for them. The size of the effect is carbon specific: one activated carbon study rose from about 51 mg/g at pH 2 to about 92 mg/g at pH 8. Record initial and equilibrium pH plus background salts, since ionic strength screens the same forces pH tunes.
Contact time. Uptake climbs steeply, then flattens. Only the plateau value is qe; anything earlier is qt. Published equilibration times span minutes to many hours across different carbons, with 24 hour contacts in some standard procedures. Determine the plateau kinetically for your carbon instead of assuming two hours suffices.
Temperature. No universal direction exists. Uptake rises with temperature in endothermic systems and falls in exothermic ones, so measure it rather than assuming.
Particle size and agitation. Finer particles shorten diffusion paths and usually speed uptake; stronger agitation thins the stagnant film around particles and does the same. Both change the rate, not the equilibrium itself. A capacity that responds to stirring speed is a warning that equilibrium was never reached.
Reagent identity belongs in the record too, which is why checks on dye purity and specification sit next to the carbon mass: methylene blue may be sold as the anhydrous salt near 319.9 g/mol or the trihydrate at 373.90 g/mol, and commercial assay is often below 100 percent. Nominal C0 computed from the wrong formula weight makes every qe systematically wrong.
What the fitted curves do and do not say
A Langmuir fit writes qe as qmax times KL times Ce divided by (1 plus KL times Ce). It yields a fitted saturation capacity qmax in mg/g and an affinity constant KL in L/mg. A good fit means this particular saturation curve describes the measured concentration range well. It does not prove the carbon has one uniform population of sites, that coverage is strictly a monolayer, or that any specific molecular mechanism operates. Heterogeneous porous carbons routinely produce Langmuir shaped curves over limited ranges.
A Freundlich fit writes qe as KF times Ce to the power 1/n. KF sets the empirical capacity scale and 1/n sets the curvature. Because this form has no finite plateau, it must never be extrapolated to invent a qmax. A better Freundlich fit only means its rising shape matches the measured interval better. Whichever equation is used, prefer nonlinear regression on the original form, because linearized transforms distort the errors, and inspect residuals rather than trusting R squared alone.
What 914 experiments teach
A machine learning analysis of 914 experiments from 75 papers modeled methylene blue uptake across clays, ashes, and alkali activated materials with gradient boosted regression trees. Its headline result: initial dye concentration was the dominant predictor of reported uptake, with pH, raw material identity, and modification type also important, and with strong interactions between concentration and nearly every other variable including dosage, surface area, contact time, and agitation.
Two cautions keep this finding useful. First, that study did not cover activated carbon, so it cannot rank variables on carbon. Second, its lesson is methodological and transfers cleanly: initial concentration is never a nuisance variable, and operating conditions interact with material properties too strongly for any headline mg/g ranking to survive the loss of its conditions. That is the same conclusion the worked calculation reaches from first principles.
Two mistakes to stop making
First, stop reporting removal percentage as capacity. A heavy dose can decolorize 99 percent of a weak solution while holding few milligrams per gram, and a light dose in strong solution can hold hundreds of milligrams per gram while leaving visible color. Always report C0, Ce, V, m, dose in g/L, removal percentage, and qe together, or the number cannot be reused.
Second, stop calling a fixed time value qe without showing the kinetic plateau, and stop standardizing the dye by label weight. Verify equilibrium with a time series, verify concentration spectrophotometrically rather than trusting the weighed label given the hydrate and assay problem, and control pH, temperature, particle size, and agitation. A methylene blue capacity with those entries attached is a transferable measurement. Without them it is an anecdote.